Datadog
Existing Mobile Dashboards
If you have issues accessing the dashboard or the VA Datadog site reach out in the VA mobile slack channel
Creating Alerts
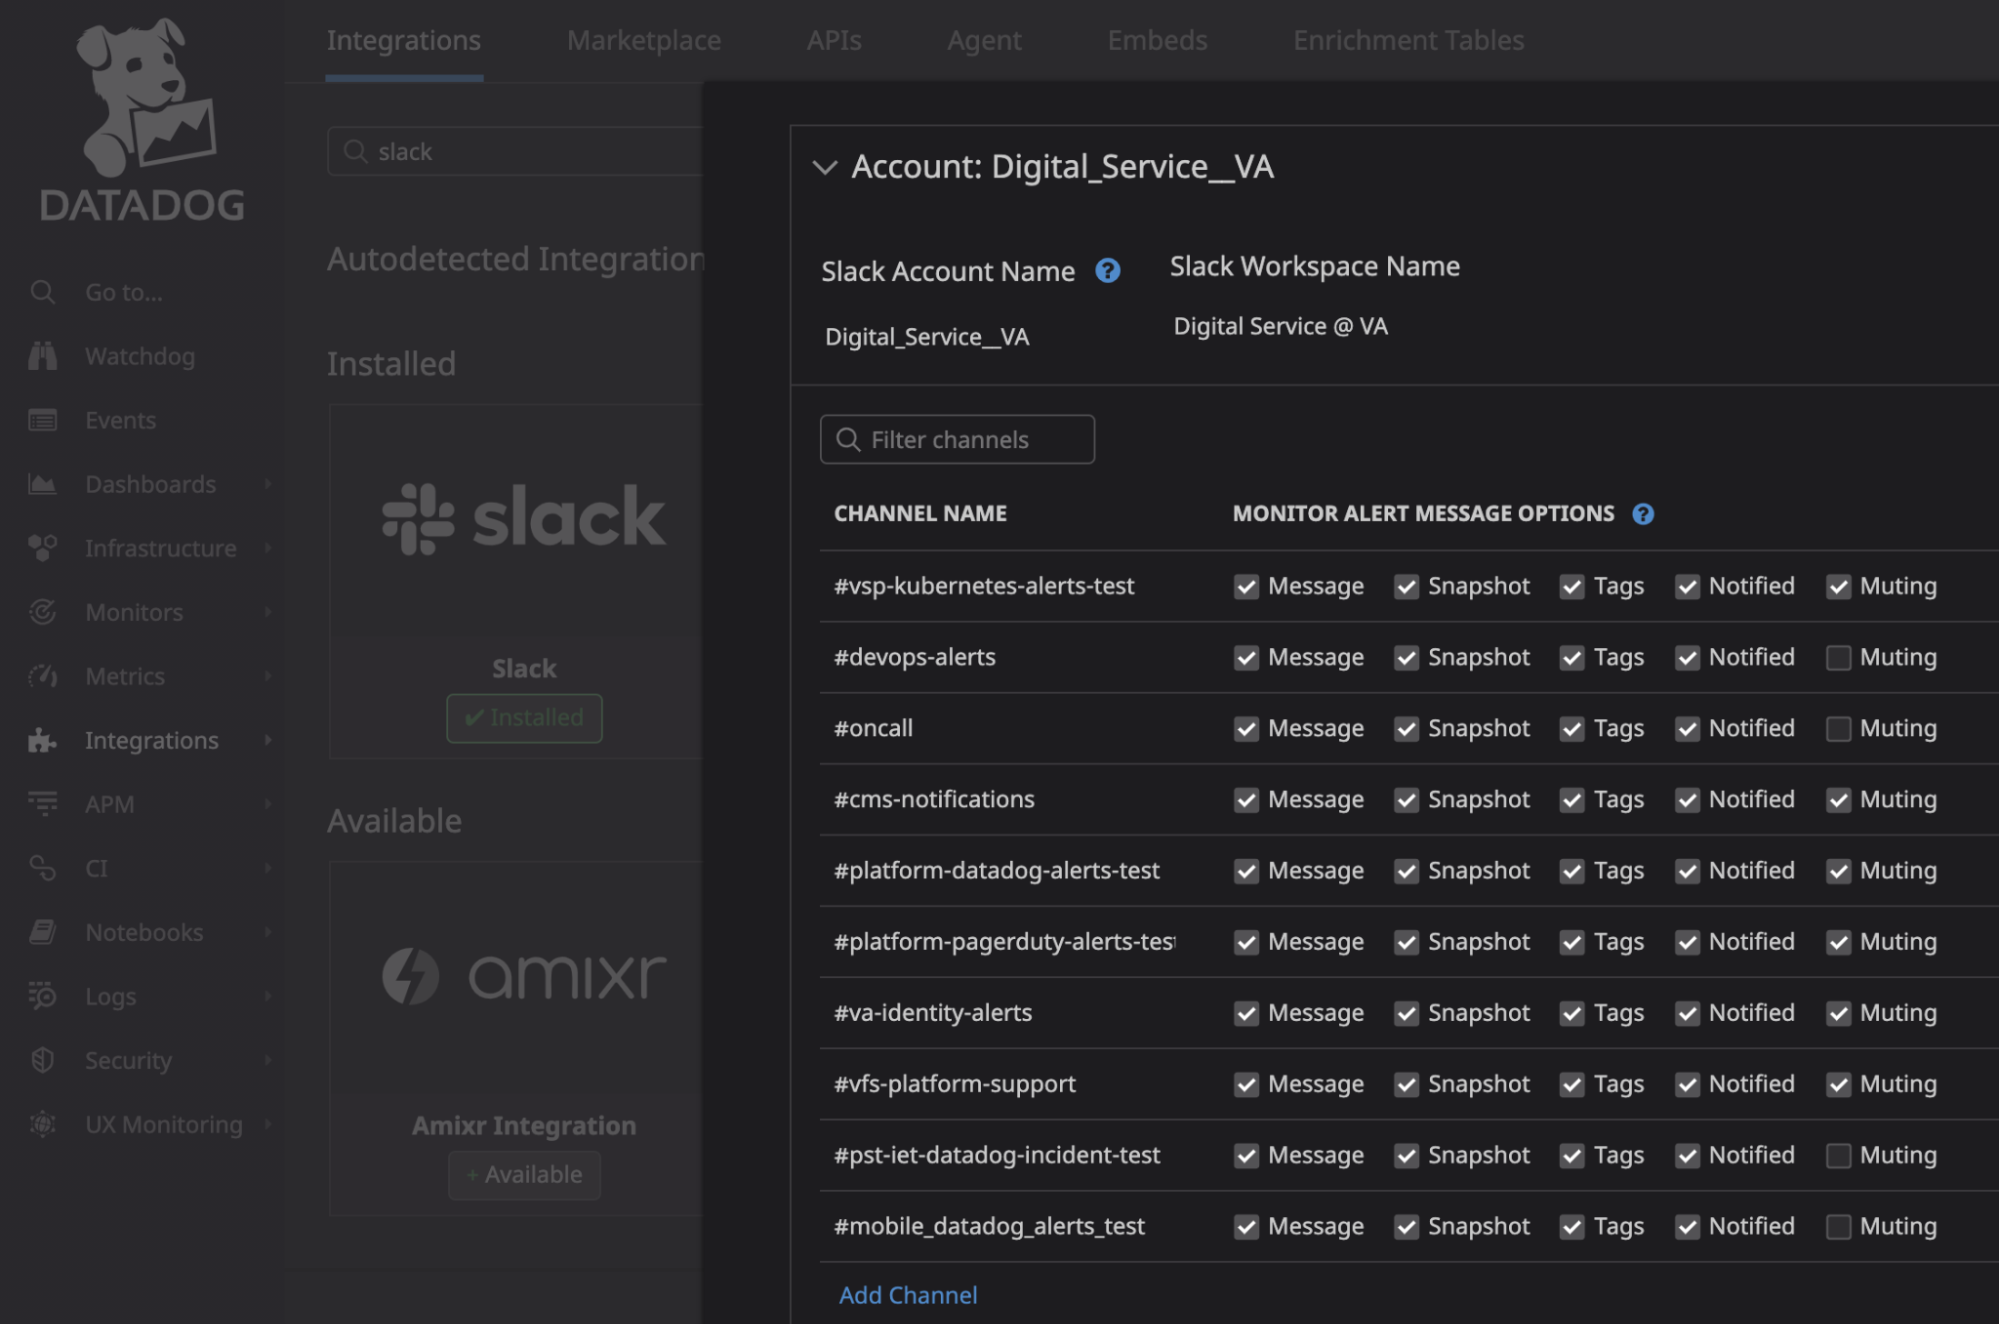
Reference existing alerts linked above to define new alerts. To receive alert messages in slack the Datadog slack tool will need to be added to the channel where you want notifications then the channel also needs to be added via the slack integration within Datadog. Once this is complete the channel will be in a dropdown in the 'Notify your team' section shown above. Slack integration docs


Read more about Datadog on the official documentation
New Issues Monitor
The new issues monitor alerts us to any new errors (i.e., 400+ response status with stacktraces that have not been seen before) that occur in requests that route through the mobile module. It is configured to send an alert to the mobile-new-issue-alerts slack channel anytime a new issue is seen. Many of the new issues are non-concerning and may not appear to be new at all. Changes in the stacktrace can make DataDog consider an issue "new" even if the same error has occurred before. As a result, we need to investigate each new issue to determine whether it's a problem or not.
The slack posts sent from DataDog to slack link to the new issue alert, which generally does not contain enough information to understand the underlying problem. To find the stacktrace:
- Go to VA Mobile new issue monitor
- Expand the date range if necessary
- A list of new issues that were observed during that date range will appear in the Events -> Messages section
- Click on the error. An error detail modal will emerge from the right side of the page and with the detailed error message.
- Click “View in Error Tracking”. This will navigate to a list of new errors that were observed during a period leading up to the error. This will sometimes pick up other new issues that occurred during that period and may include instances of the error observed by both the mobile-app and vets-api APMs.
- Sometimes this will be empty and the only path forward is to search logs for the error message
- Click on the instance of the error. An error detail modal will emerge from the right side of the page
- Sometimes this modal will correctly attach to the error stack trace
- Other times, it will not provide any stacktrace. In those cases, you can:
- Search logs for the error message
- Click “Investigate in APM” button