Logs
This section goes over the process of how to access, search, and parse logs on Datadog
How to Access and Search Logs
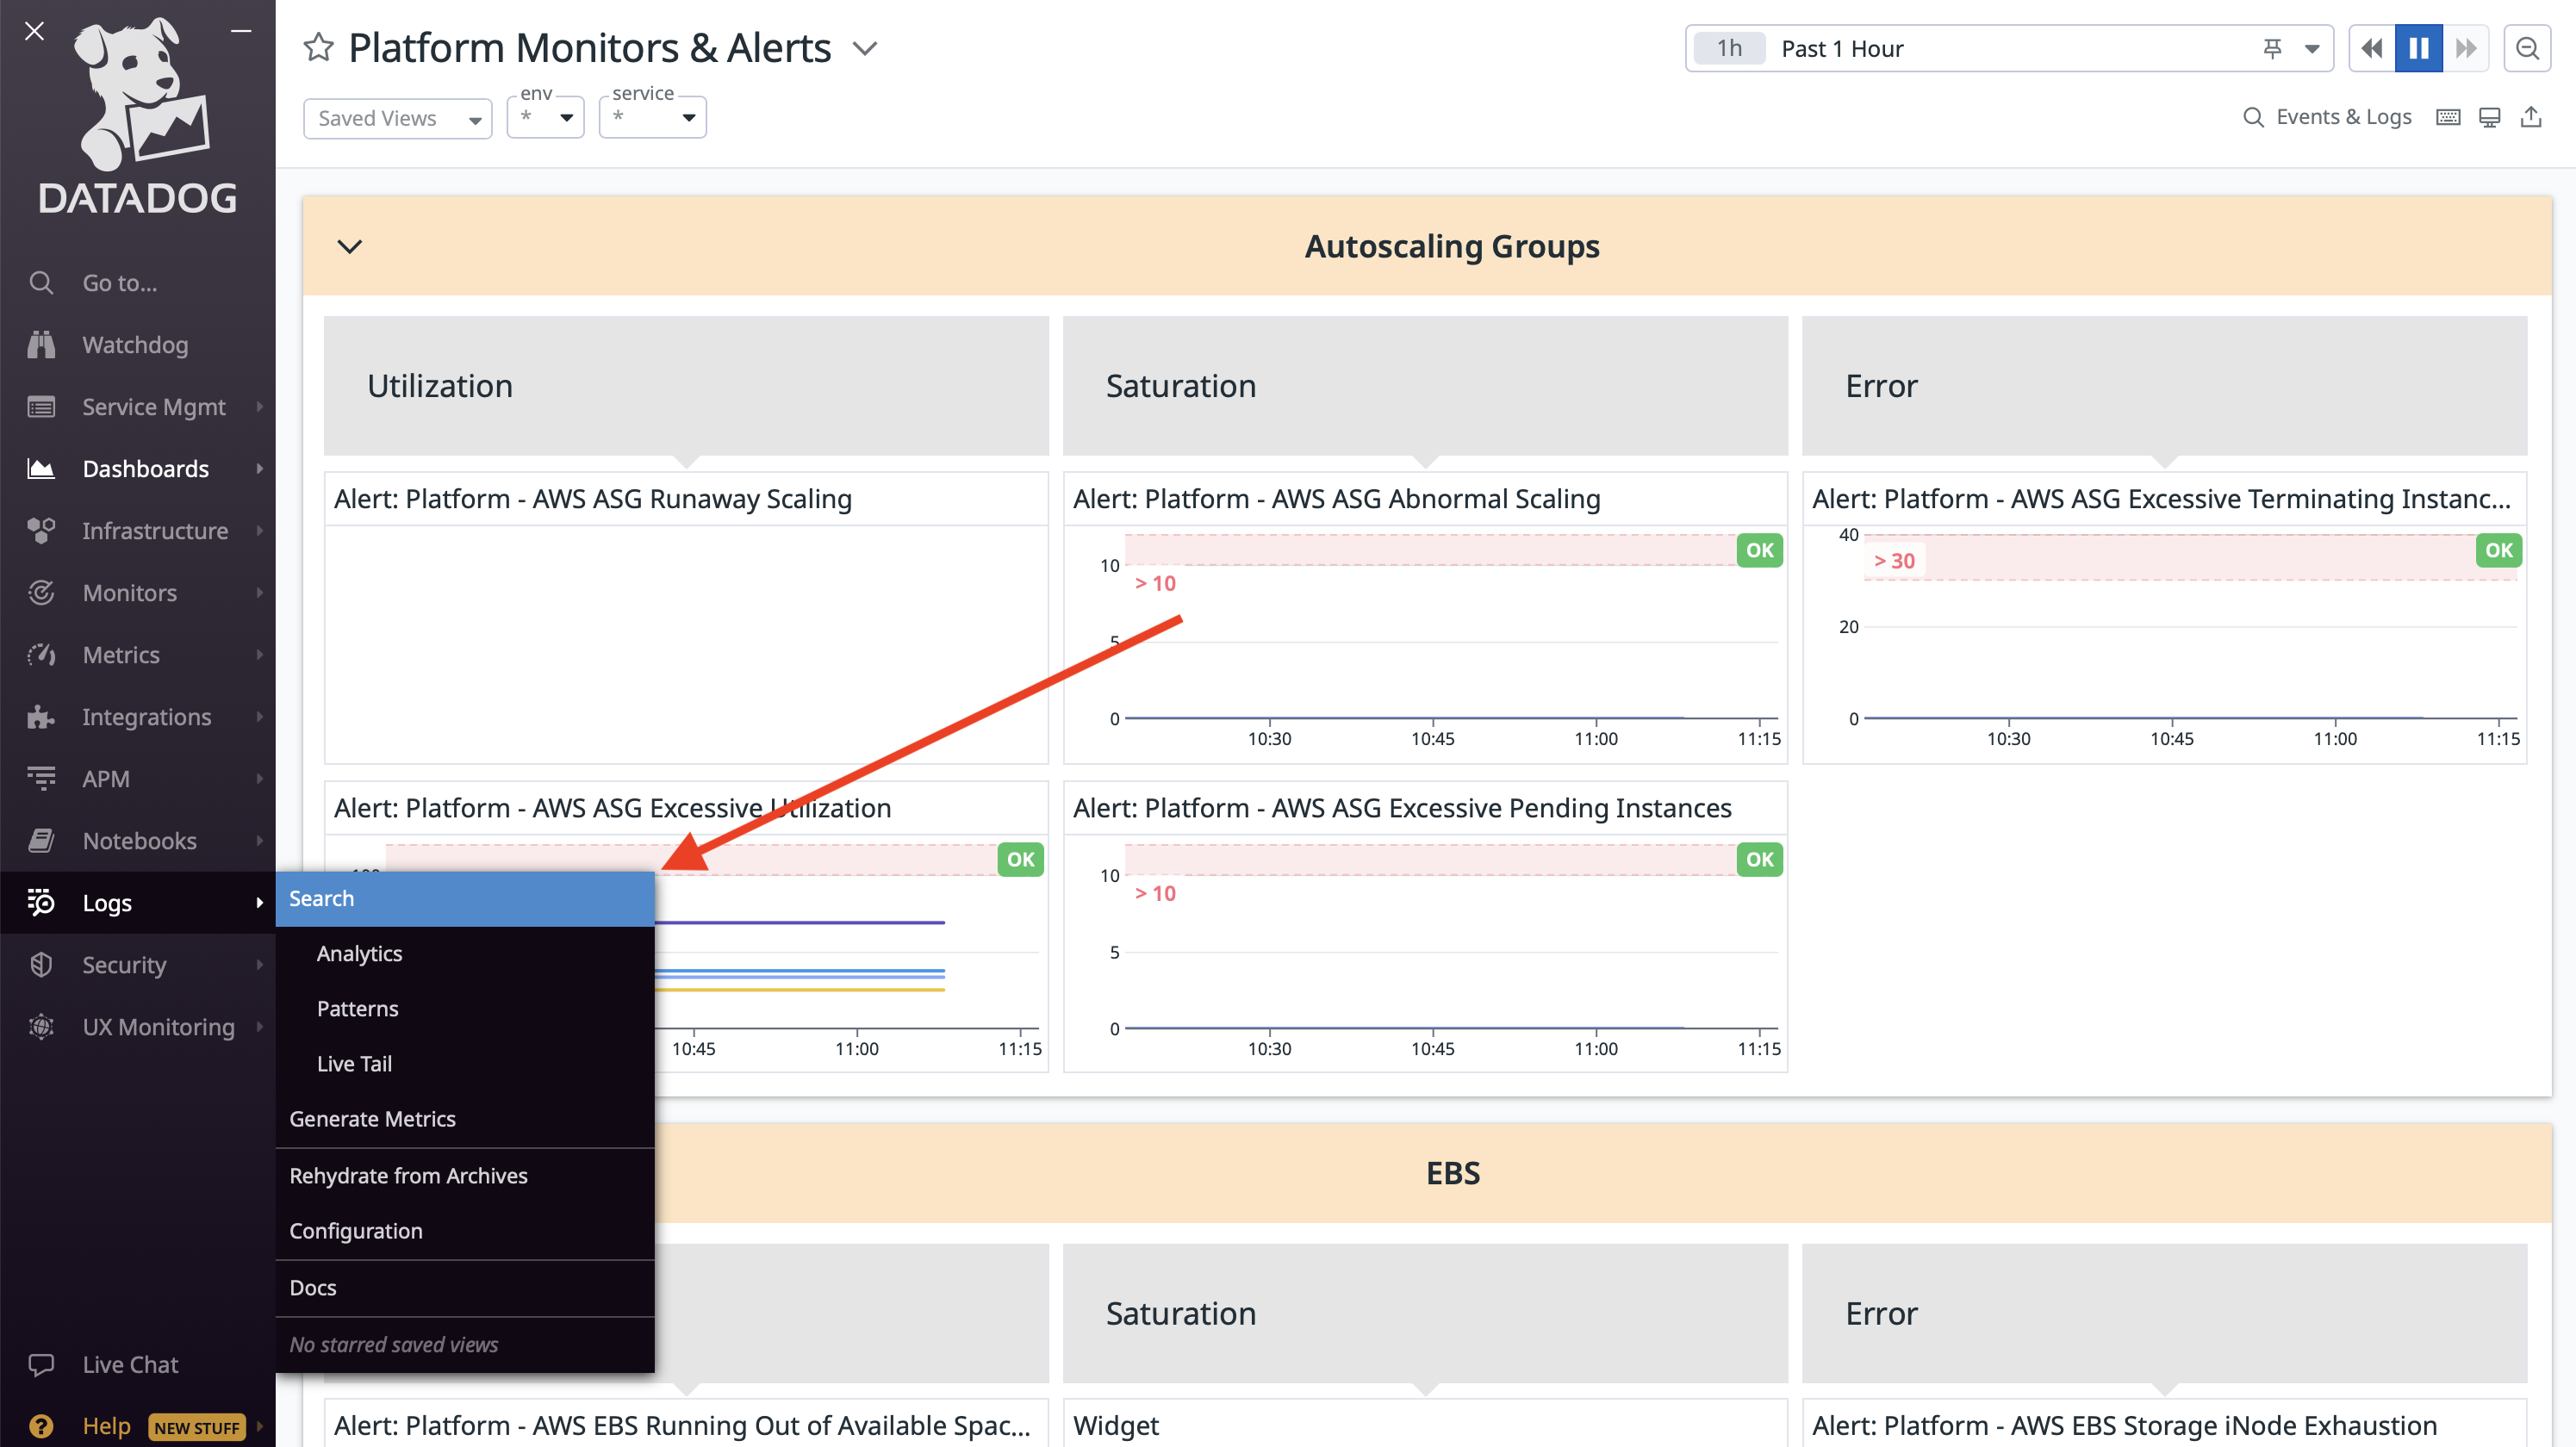
Locate the Logs section in the menu on the left, and select search. From this screen, you should be able to find all logs that you may need.
A few things to keep note of:
- At the top, DataDog defaults to searching for logs in the past 15 minutes. This may not be a wide enough window for you to find what you want
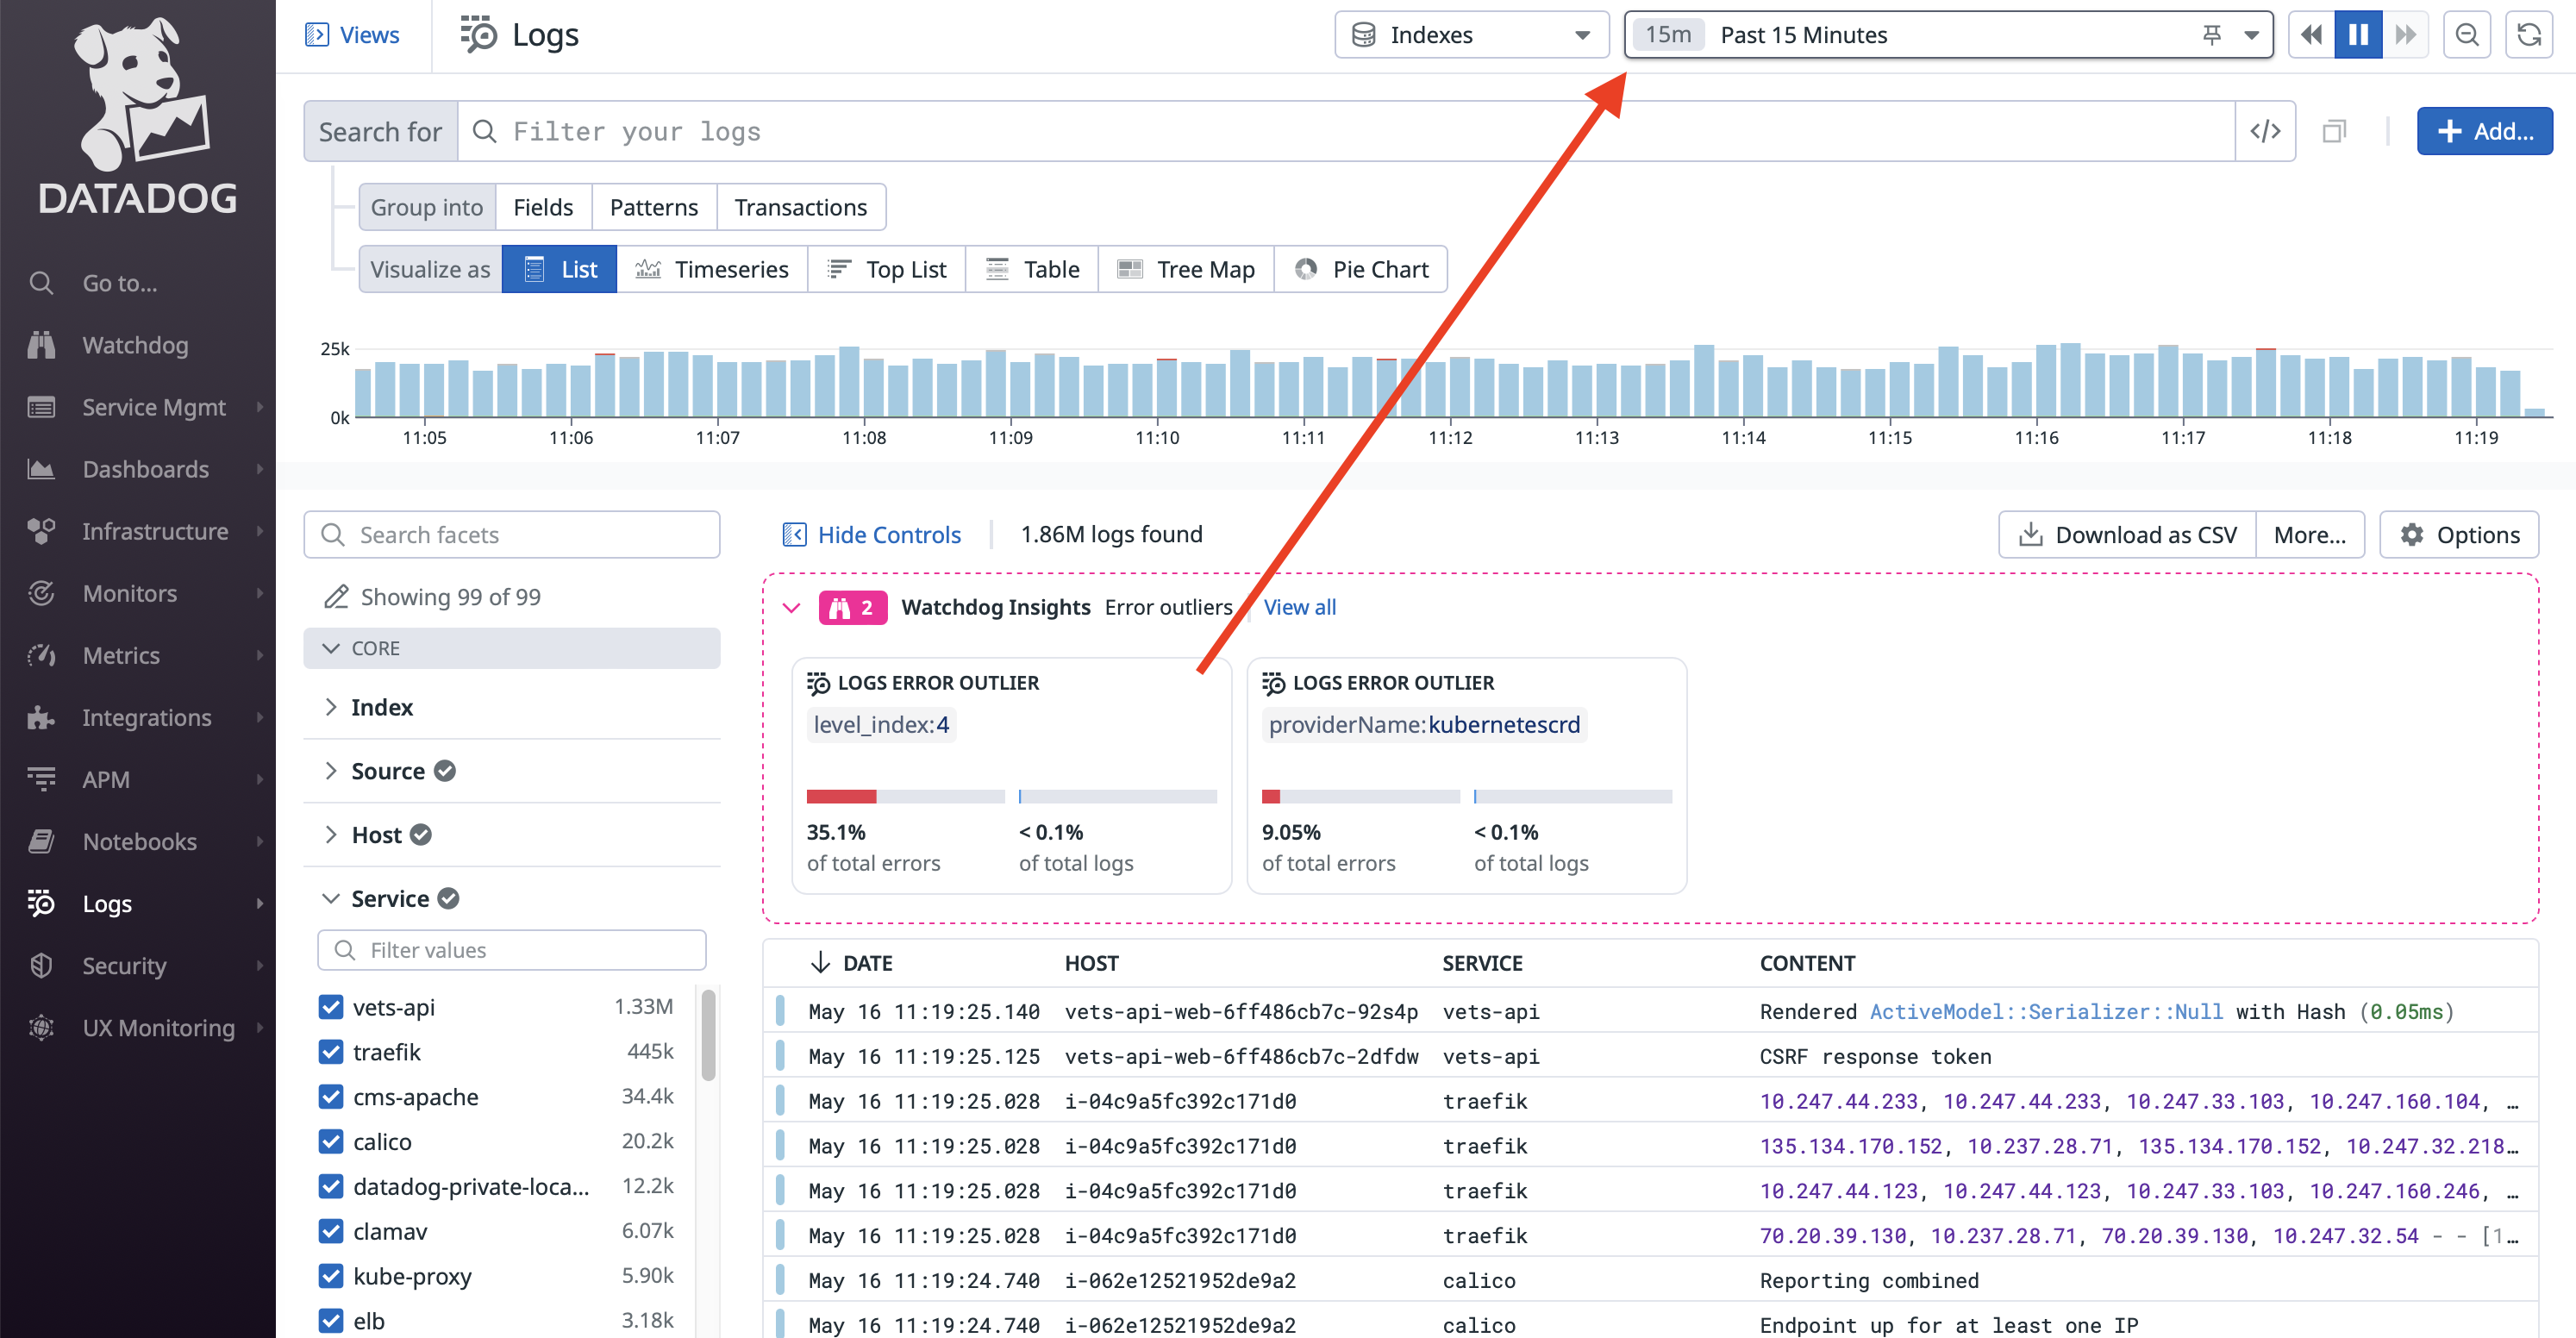
- The "Search for" section does not allow you to search something as simple as
mobileto find all mobile endpoints. It is best to select thefacetsyou'd like from the menu on the left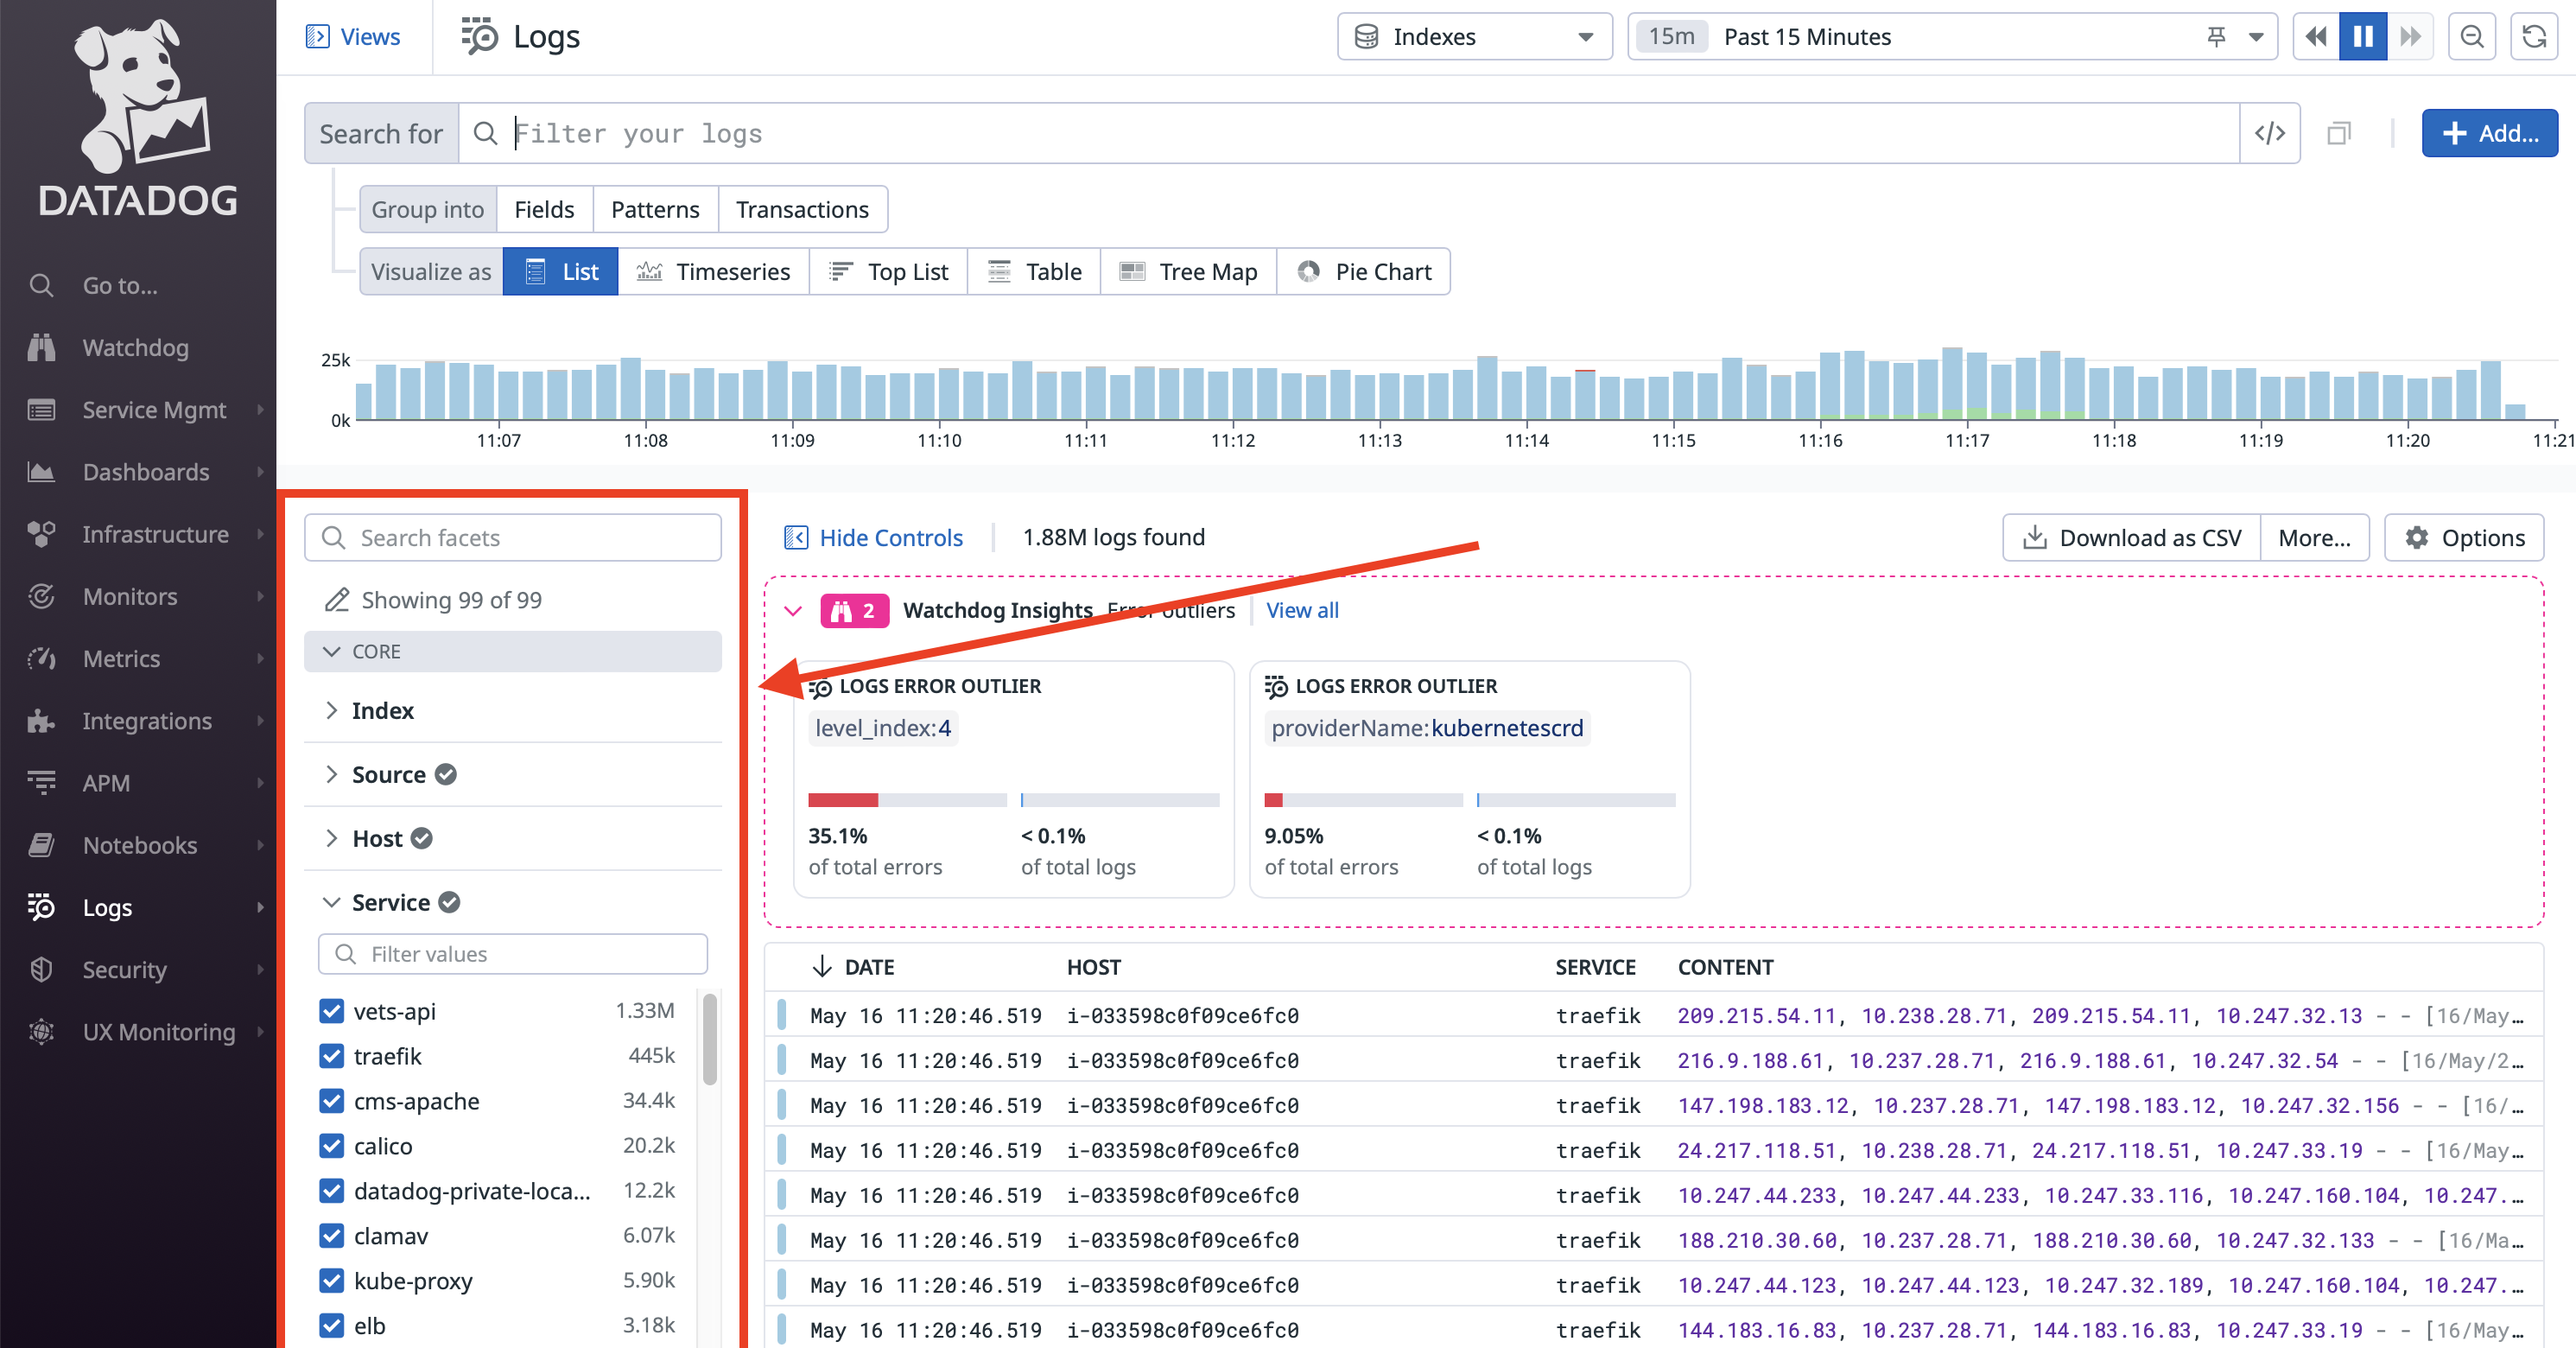
- When selecting options from the fields on the left, clicking the check box unchecks that options, clicking the text of the option itself only selects that option
- You can customize the table columns for the results. Clicking the dropdown arrow next to a column header will show options to replace the column, or insert one to the left or right. Depending on the type of search, it may be helpful to add a column that for
@http.url_details.path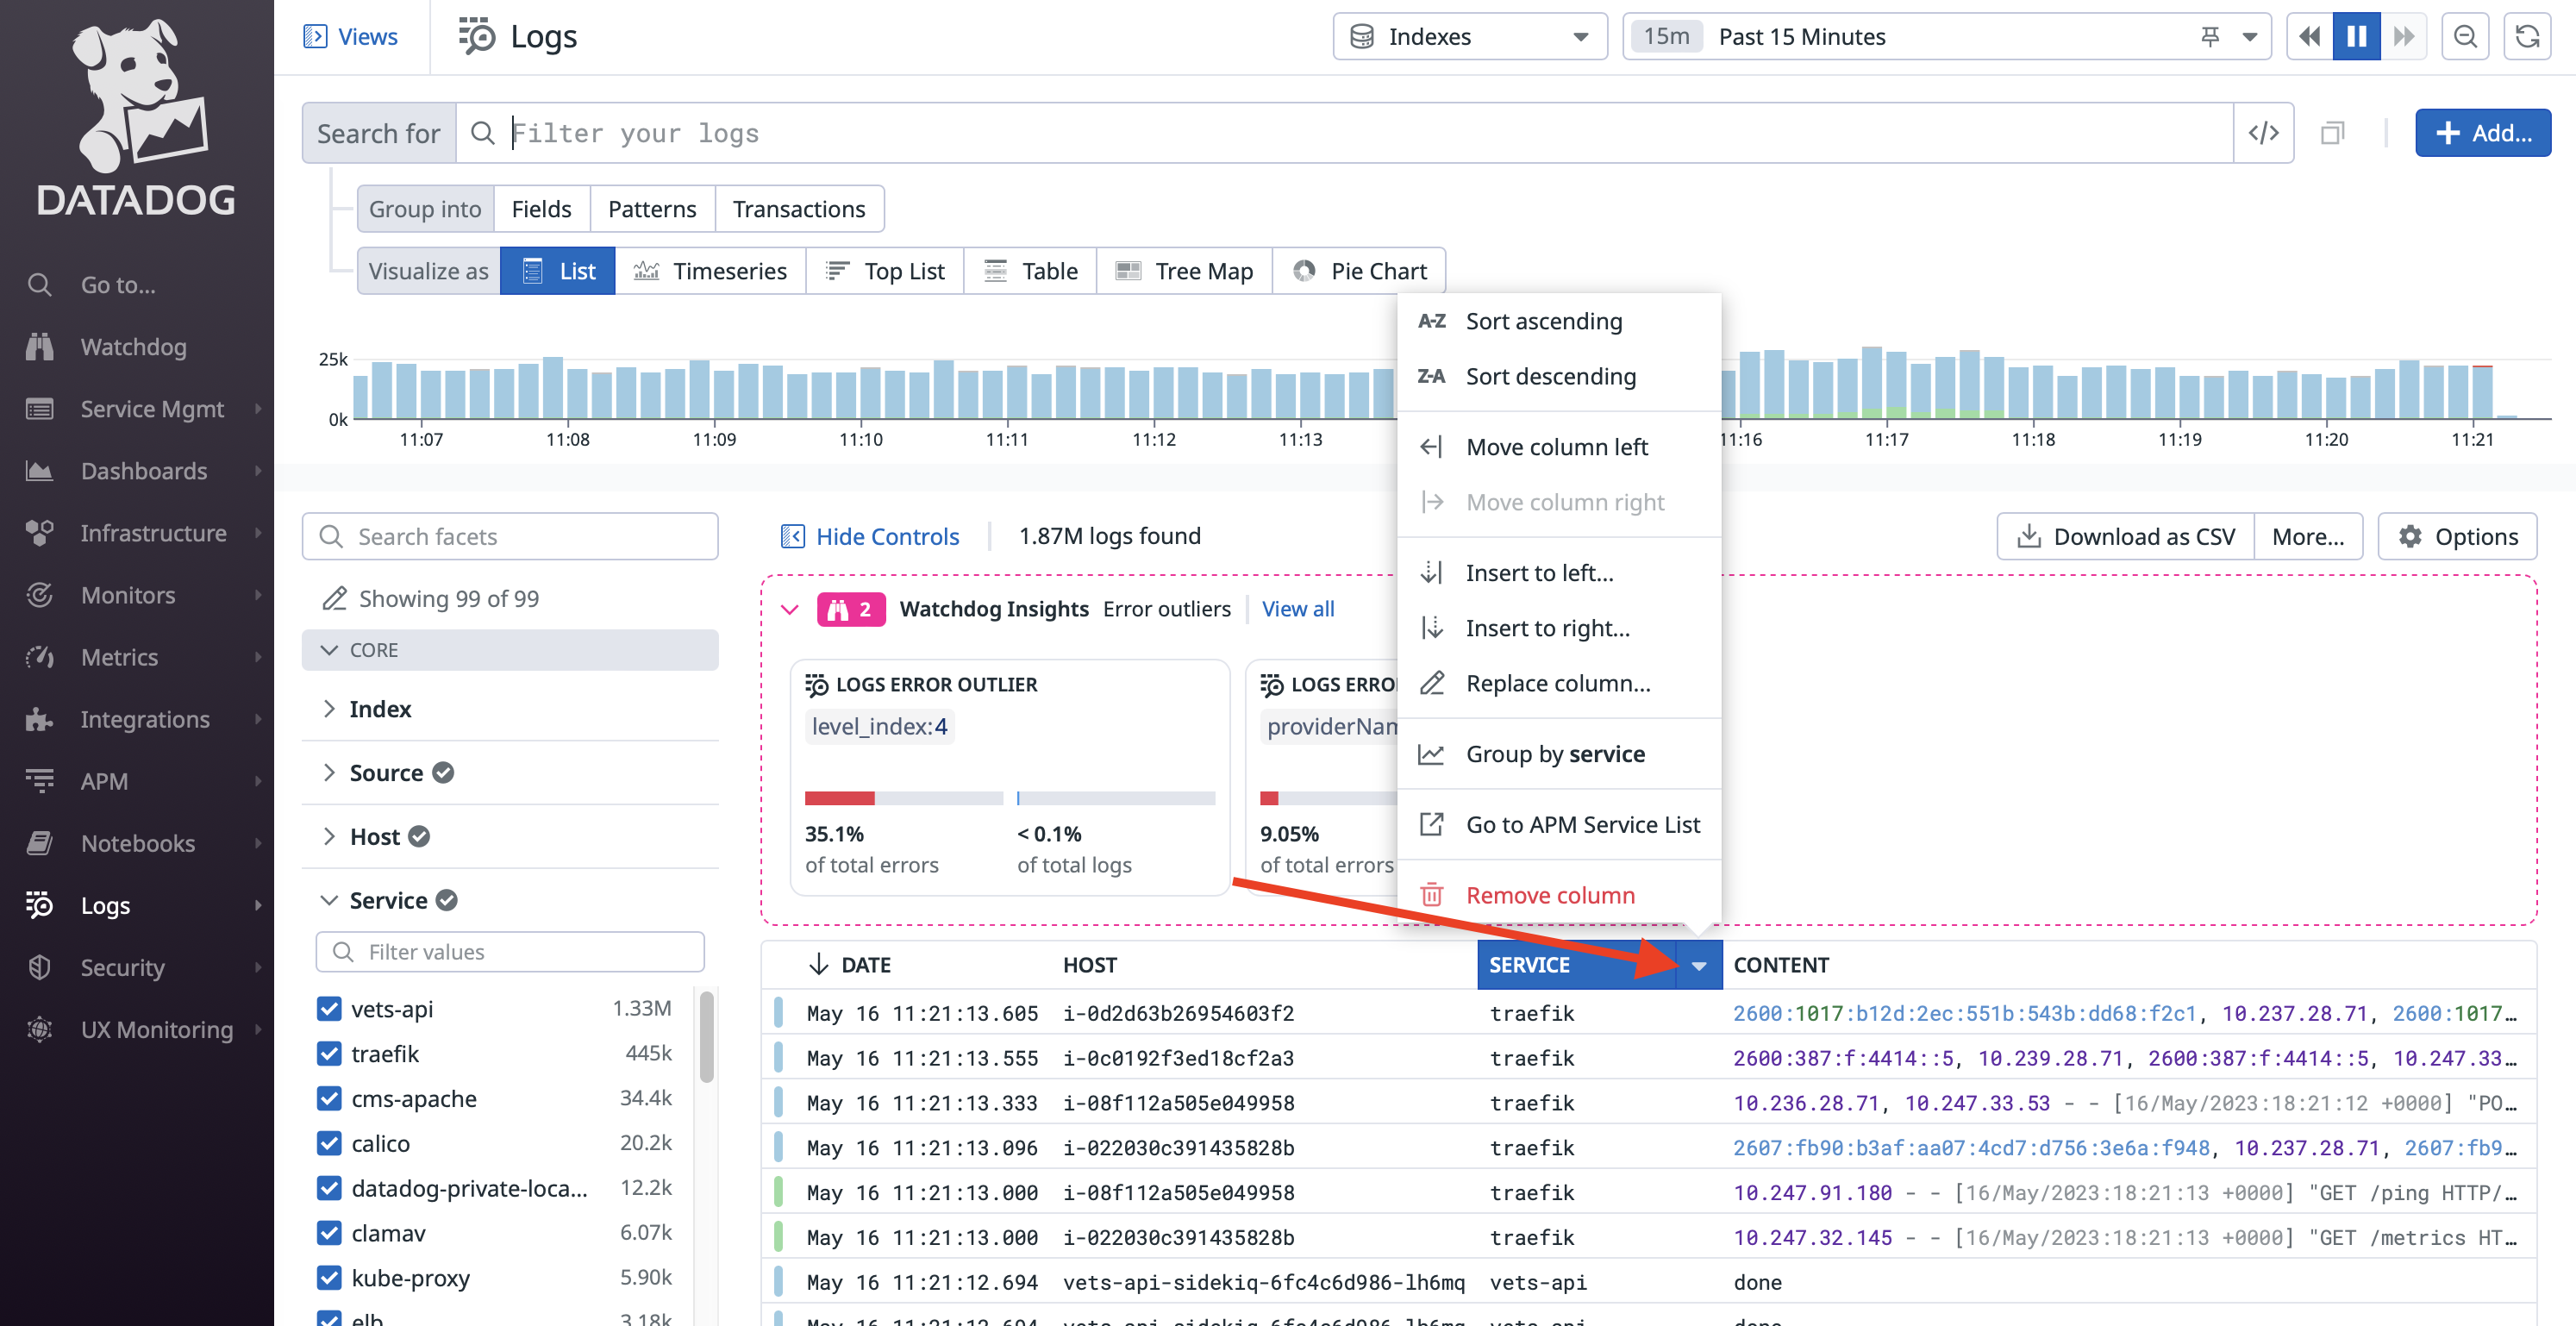
- You will most likely want to select
vets-apiunder the source option - The options on the left are populated by options DataDog found in the current timeframe. So, if you're looking for logs on an endpoint that is not used often, you may not find it in the options on the left until you change the time frame you're searching for in the top right corner
Example
Let's say we wanted to check for any errors in the past week for the endpoint /mobile/v1/user
- In the time select at the top right, change 15 Minutes to Past 7 days
- In the
URL Pathsection, search for/mobile/v1/userand click on the word itself so that all other options are unchecked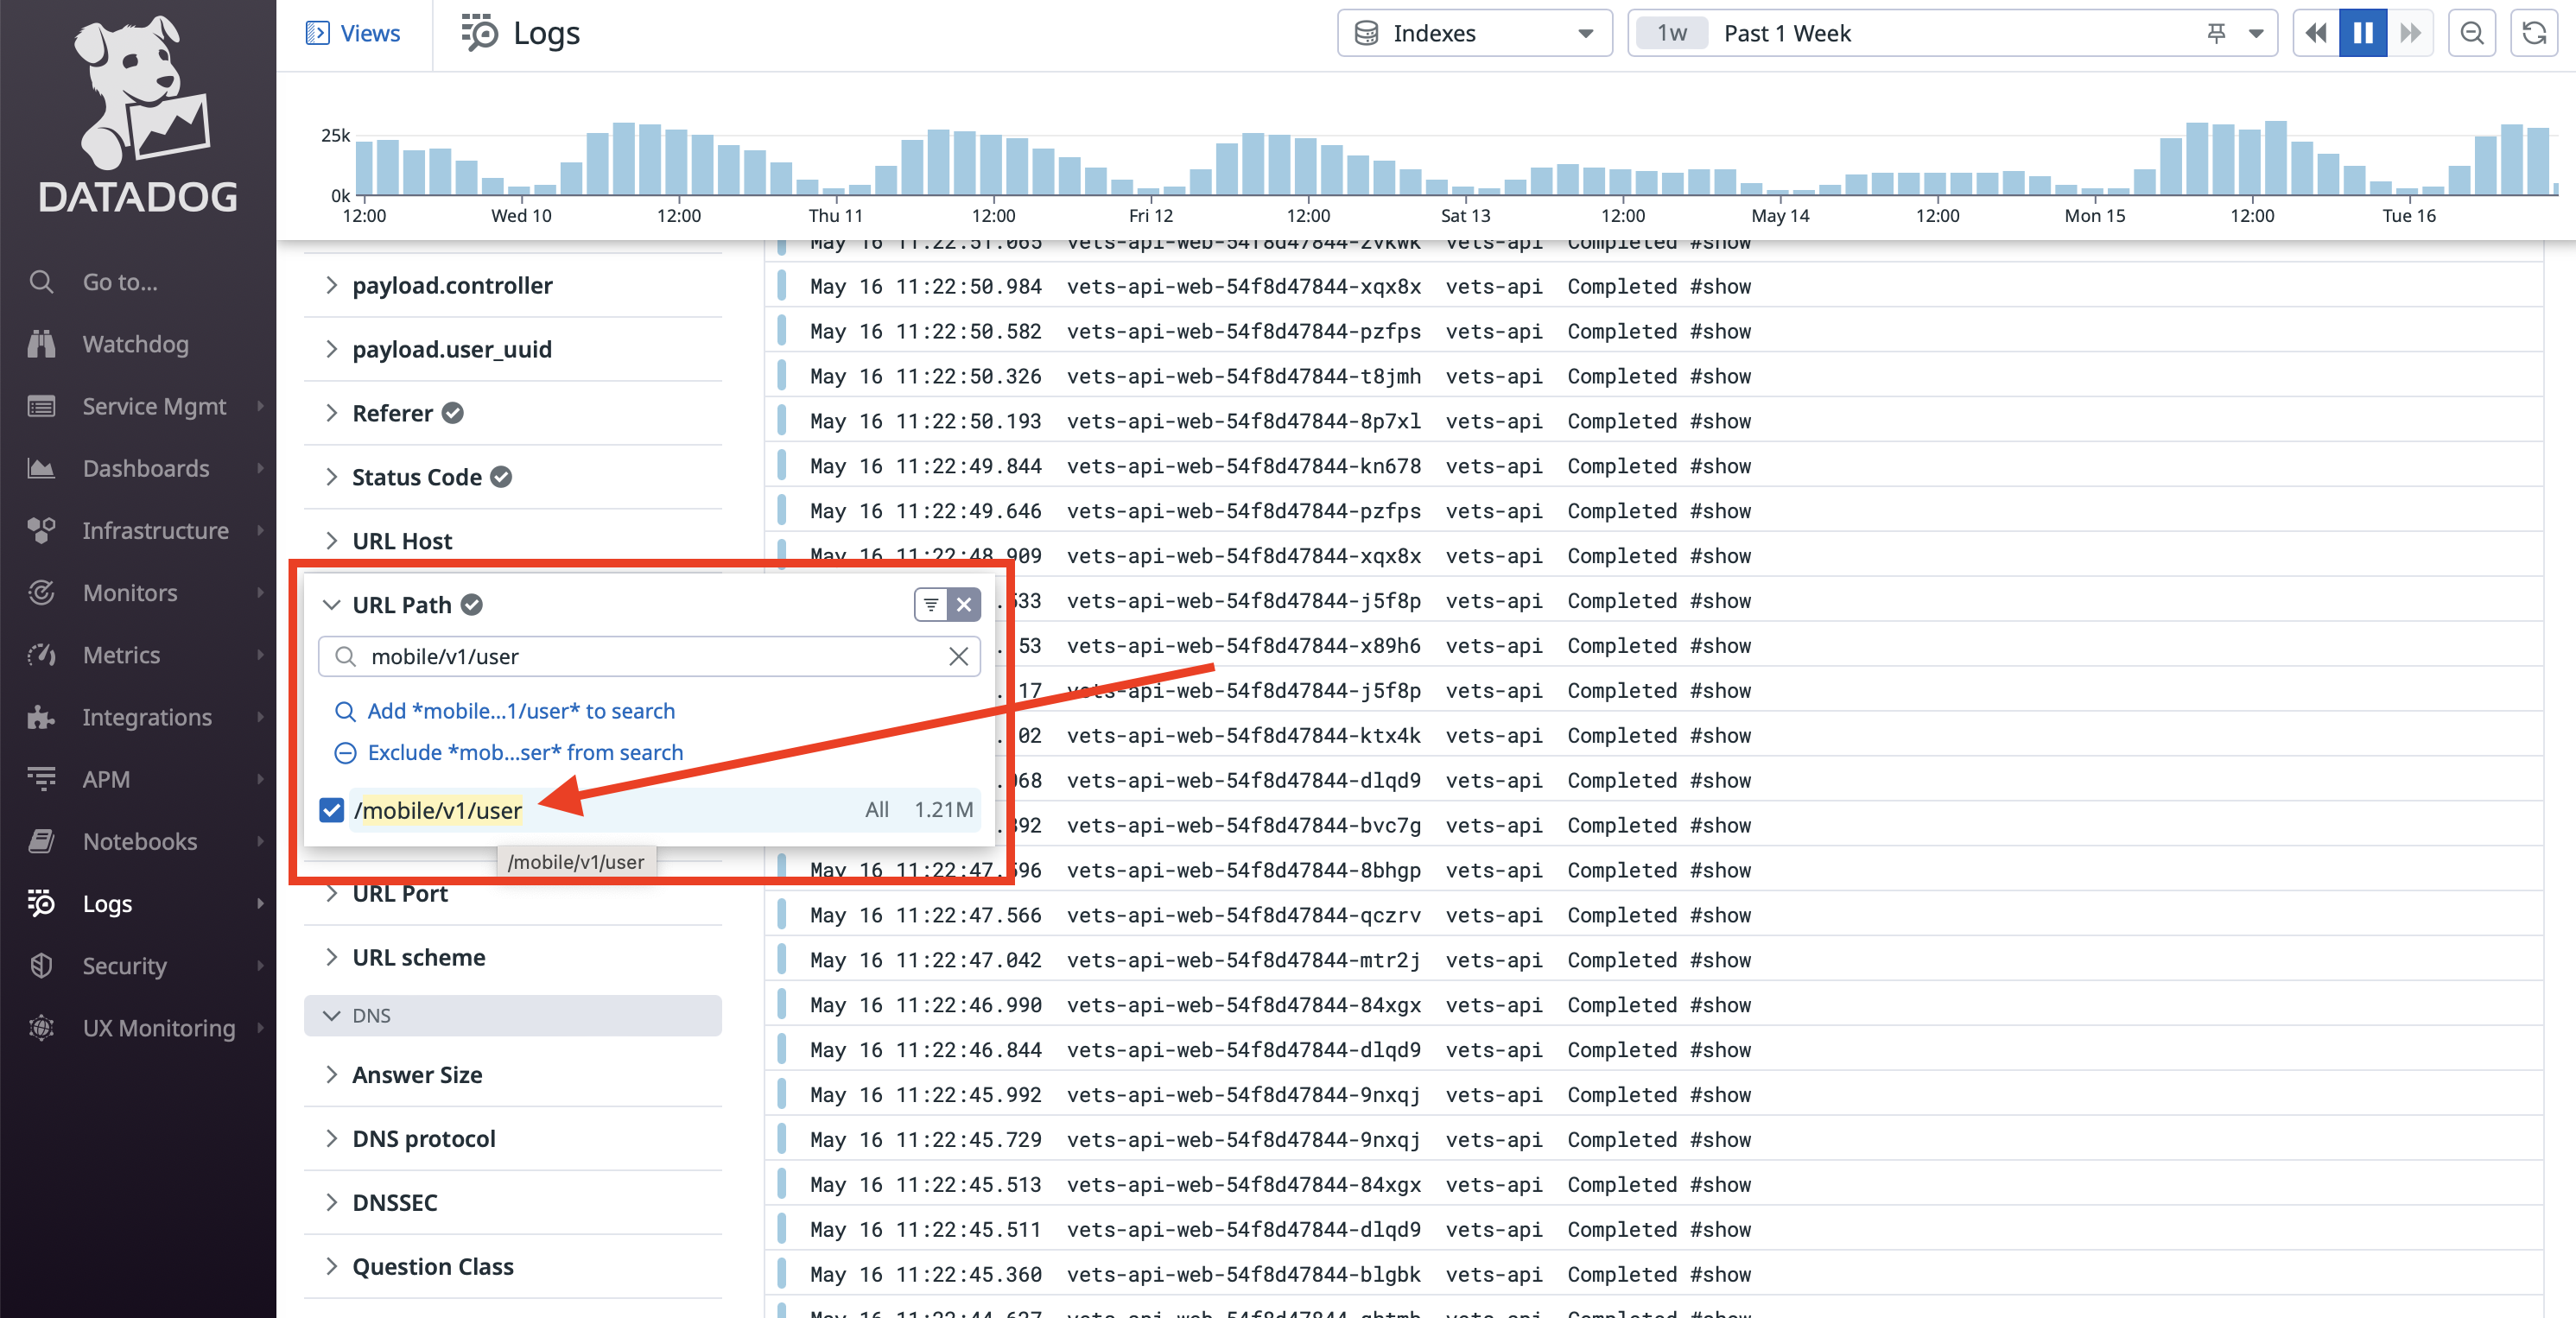
- Click on any specific logs you want to view
There are a lot of options for visualizations that you can play around with that may be helpful to your unique searching.
Worker Logs
If you wanted to search for worker logs, you can paste the following in the Search for field:
@application:vets-api-worker @named_tags.class:*ClassNameOfLogger* @message_content:Mobile*
Structured logging
When writing log statements, use structured keyword arguments rather than string interpolation. This keeps log messages static so Datadog can group them into patterns, makes every field queryable, and preserves full exception backtraces.
# Good: structured fields as keyword arguments
Rails.logger.error('Failed to retrieve eligibility details',
                   service: 'claims',
                   error_code: e.original_body['error'],
                   exception: e)

# Bad: string interpolation creates unique log patterns and loses backtrace
Rails.logger.error("Failed to retrieve eligibility details: #{e.message}")
Log levels
Use log levels that reflect whether an error is expected or unexpected:
| Situation | Log level |
|---|---|
| Expected outcome — client error, validation failure (4xx) | warn |
| Transient failure being retried | warn |
| Unexpected system failure (5xx), bug, timeout | error |
Logging expected errors at error level floods APM dashboards and leads to alert fatigue. For more detail, see the Watchtower SRE playbook:
- Prefer Structured Logs — structured logging patterns, what fields to include, and real anti-patterns from vets-api
- Expected vs Unexpected Errors — how to classify errors correctly so APM error rates reflect actual system health