Debugging Instructions
This page shows the different debug tools that we use to debug the VAMobile app. You can use your preferred method.
For all the debugging tools you need to yarn start the metro server so that the debugger can connect to it or it will not work.
Launching The Debugger
This section will apply to all the tools. More information on the react native debugging page
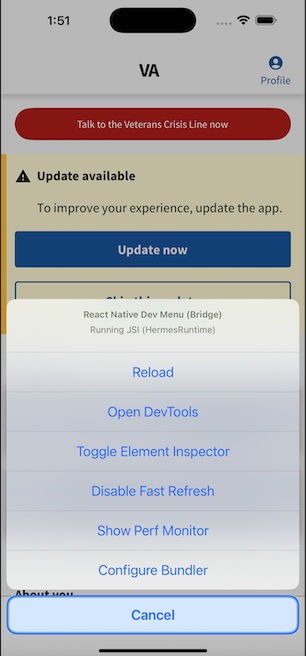
IOS
- If on physical device
Shake your device. If using asimulatorpress the shortcut⌘Dor by selecting theShake Gestureinside the hardware menu in the simulator. - On the Action Sheet select
Open DevTools
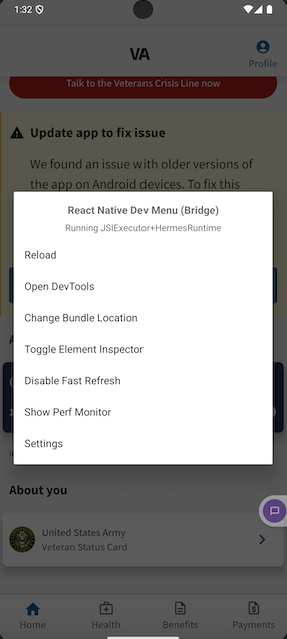
Android
- If using a physical device use
Shake your device - Android emulators:
Cmd ⌘ + M (macOS)orCtrl + M (Windows and Linux) - On the dialog select
Open DevTools
Alternatively on Android: adb shell input keyevent 82
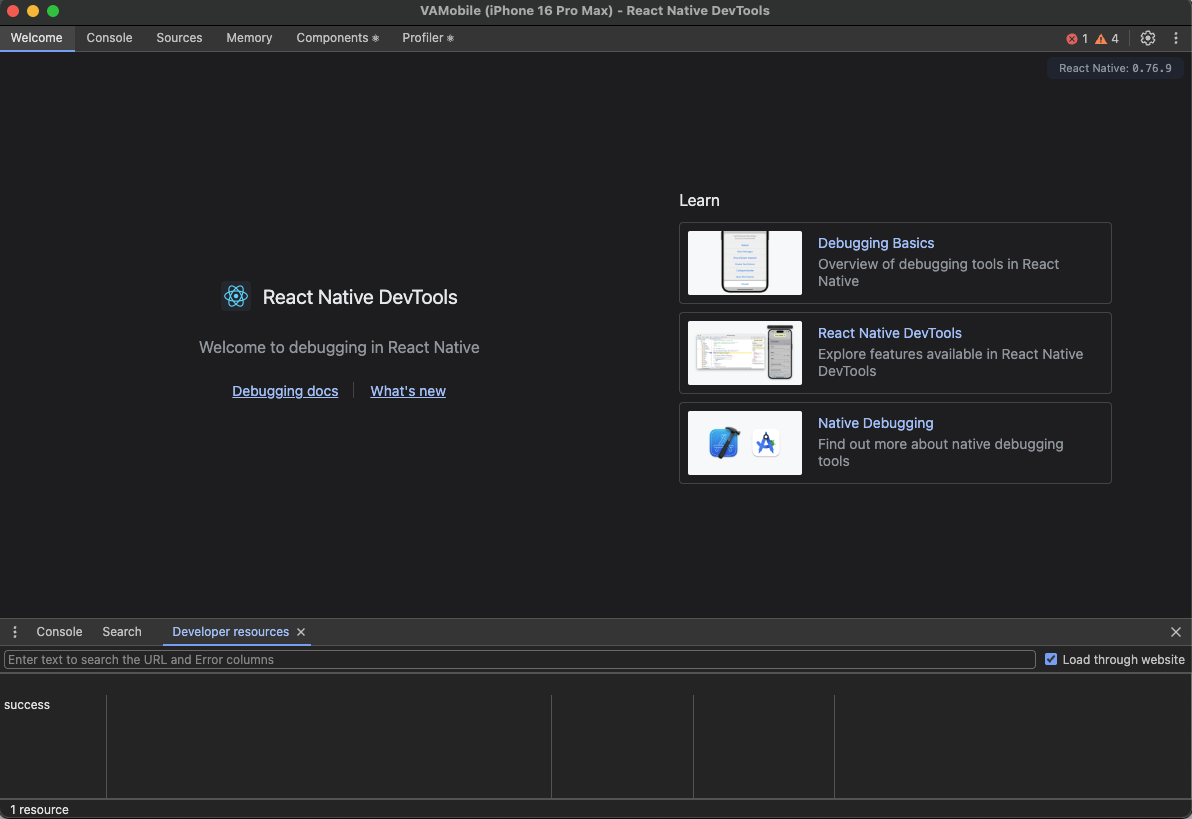
React Native DevTools
React Native DevTools is the built-in debugger for React Native, providing tools to inspect and debug your JavaScript code, similar to browser devtools.
React Native Devtools is only available with the Hermes engine, and requires Google Chrome or Microsoft Edge installed.
On first launch, it opens to a welcome panel with a console drawer for logs and runtime interaction. Use the top navigation to access features like the React Components Inspector and Profiler.
Console
The console panel allows you to view logs, evaluate Javascript, inspect object properties, and more.

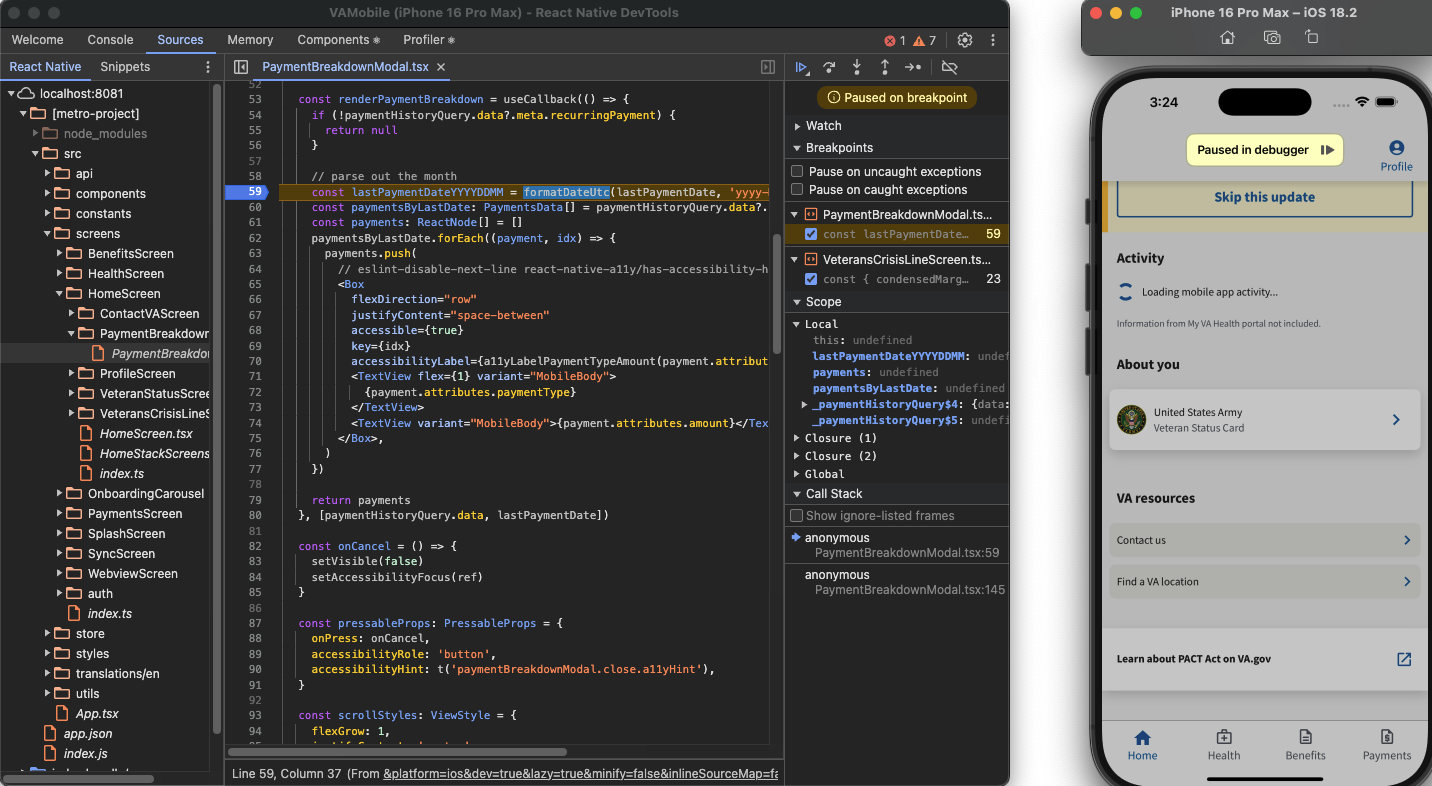
Sources and breakpoints
The Sources panel lets you view your app’s source files and set breakpoints to pause execution and inspect the live state of your code. Pause your code with breakpoints
Use Cmd ⌘ + P/Ctrl ⌘ + P to navigate to a source file
Click the line number on the left hand side to add a breakpoint
Use navigation tools at the top right to step through code
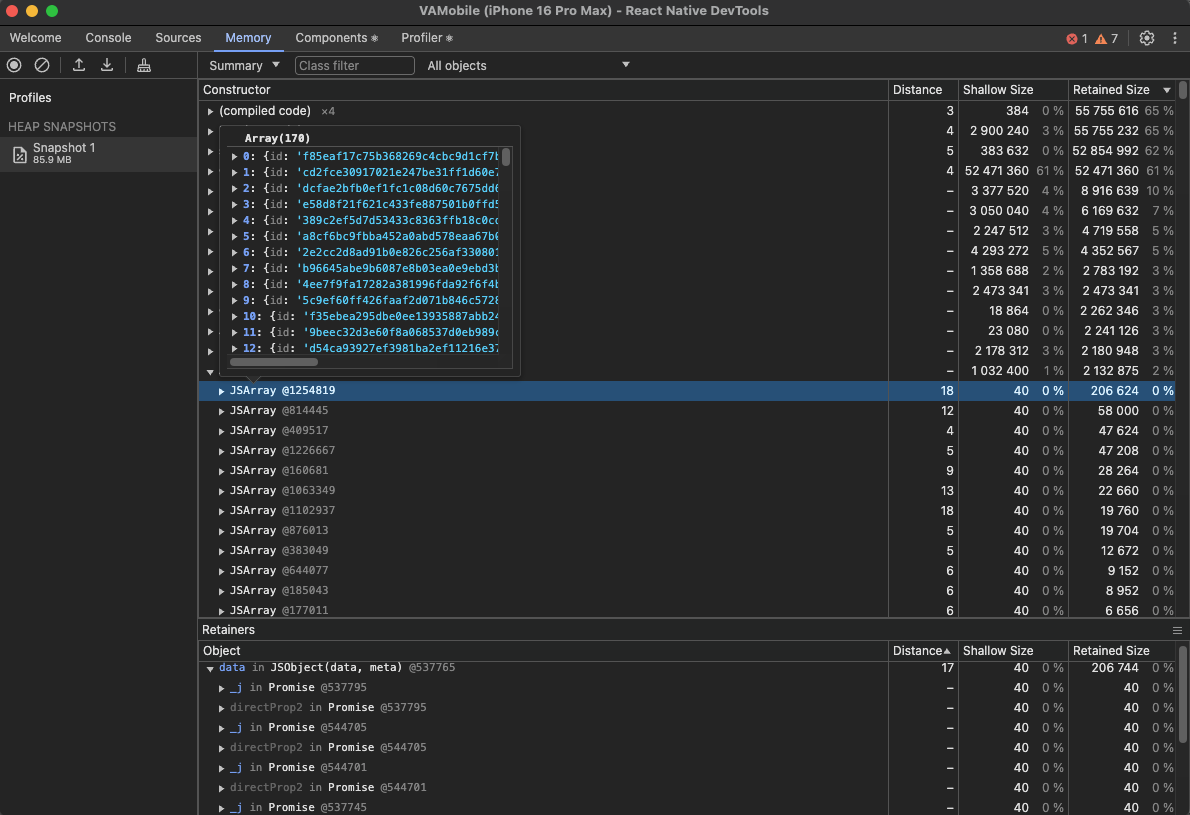
Memory
The memory panel allows you to take a heap snapshot and view the memory usage of your Javascript code over time. Record heap snapshots
React DevTool Features
The integrated Components and Profiler panels contain all the features of the React DevTools browser extension.
Components
The React Components panel allows you to inspect and update the rendered React component tree.
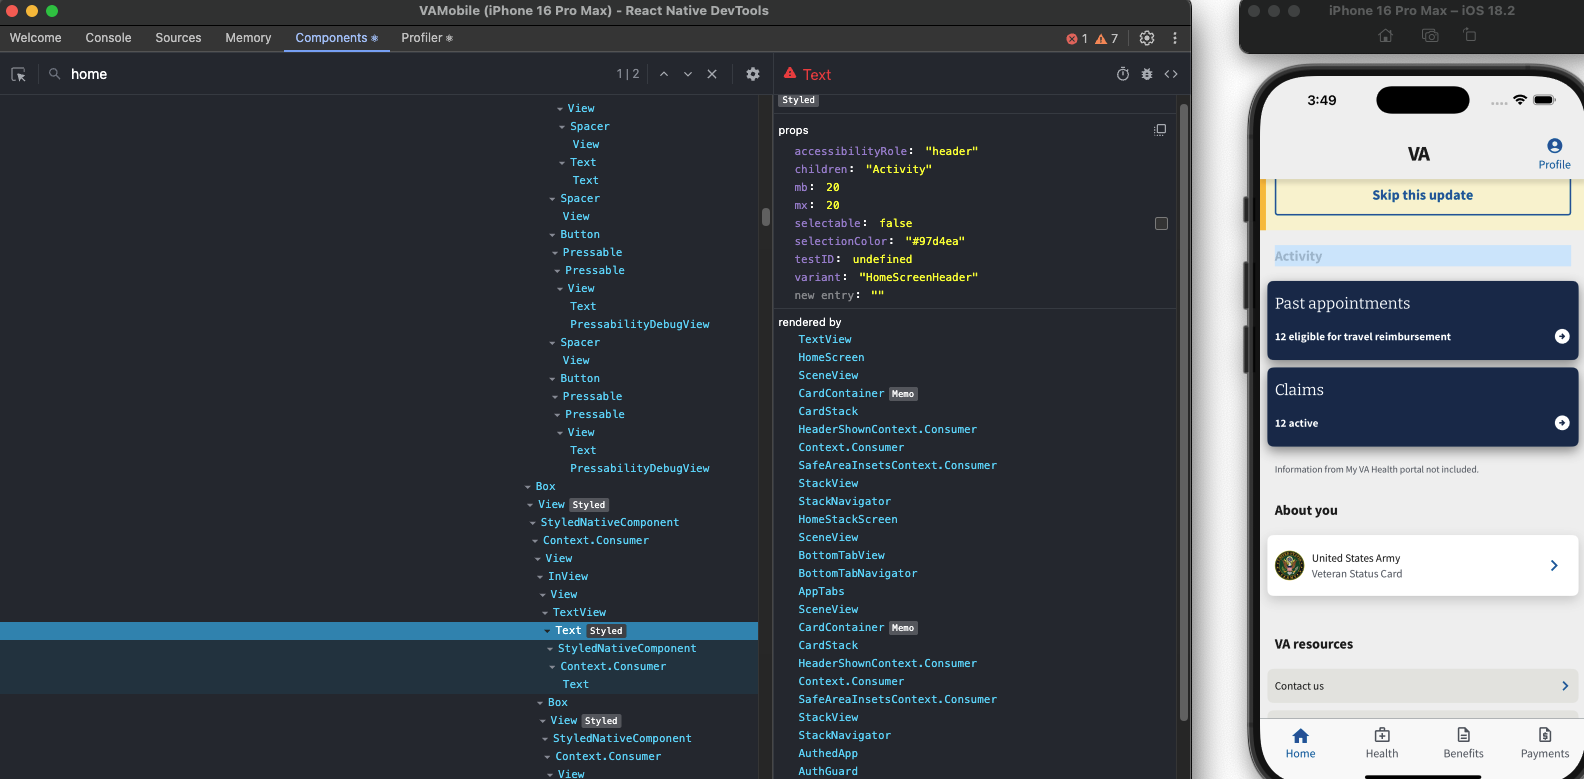
Hover or select an element on the tree to highlight it on the device
Props and state on a component can be viewed and modified at runtime
To locate an element, click on the top-left Select element button, then tap any element on the app
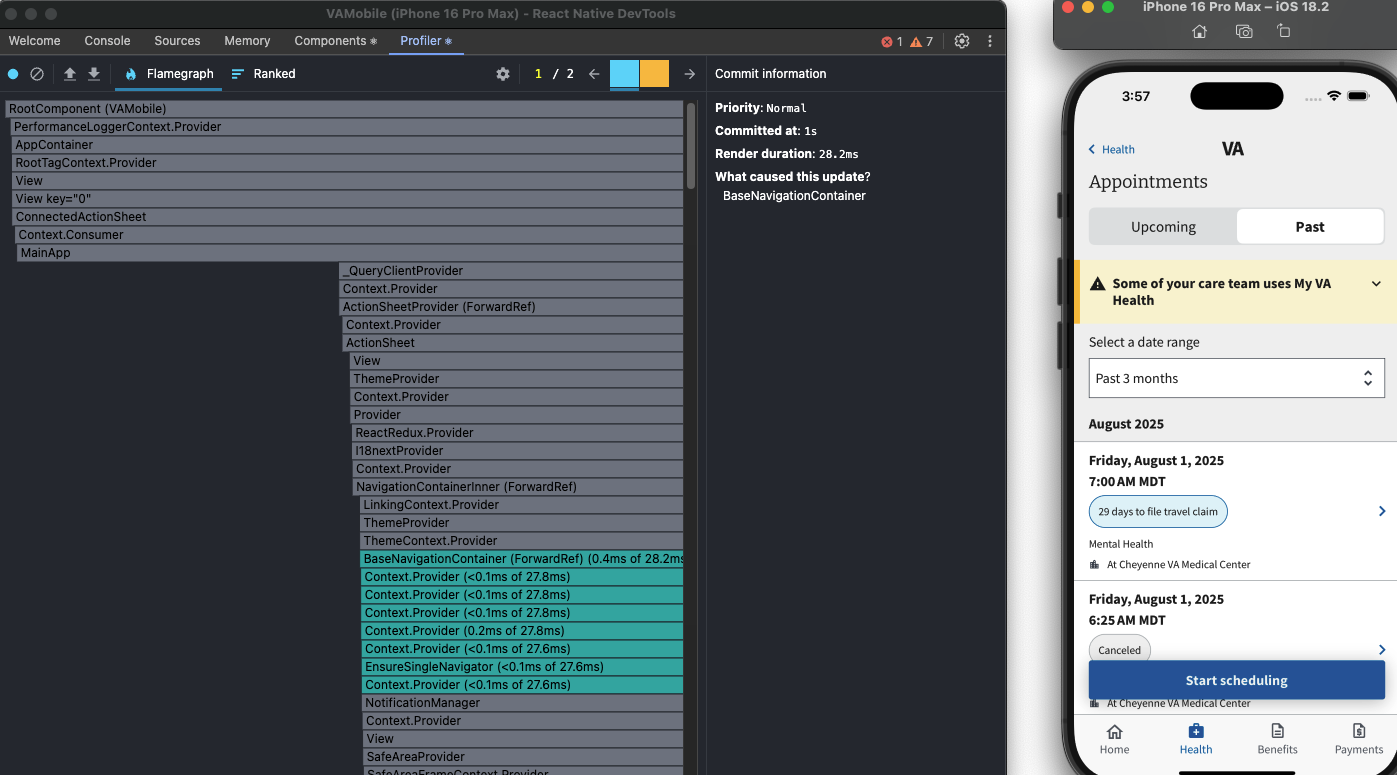
Profiler
The React Profiler panel allows you to record performance profiles and understand timings of component renders.
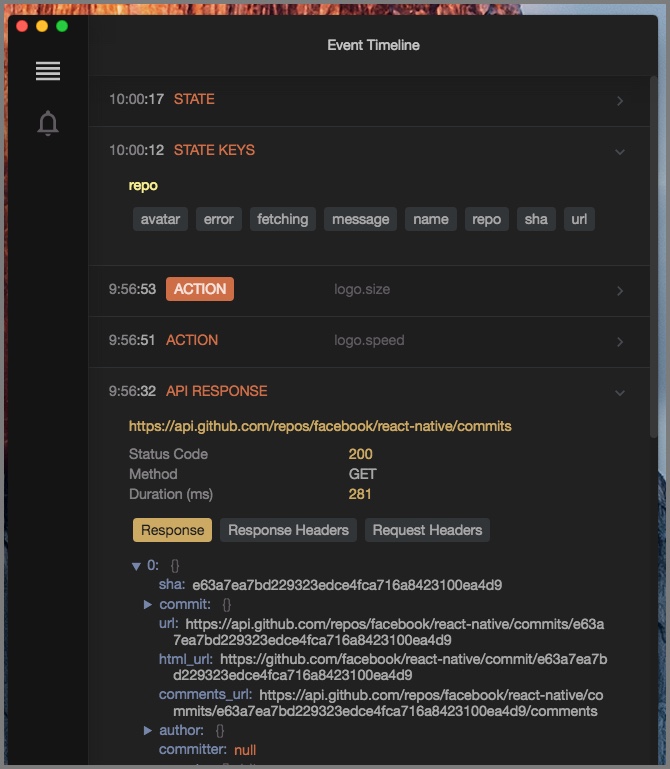
Reactotron
Reactotron is a debugging tool for both React and React Native applications. It offers a user-friendly interface that allows developers to inspect application state, track network requests, and analyze performance metrics.
Download the Reactotron Desktop App
Reactotron can be used for the following:
- view your application state
- show API requests & responses
- perform quick performance benchmarks
- subscribe to parts of your application state
- display messages similar to
console.log - track global errors with source-mapped stack traces including saga stack traces!
- dispatch actions like a government-run mind control experiment
- hot swap your app's state using Redux or mobx-state-tree
- show image overlay in React Native
- track your Async Storage in React Native
To start the Reactotron tool
- Run
yarn install - Start the app in debug mode
yarn start:debug
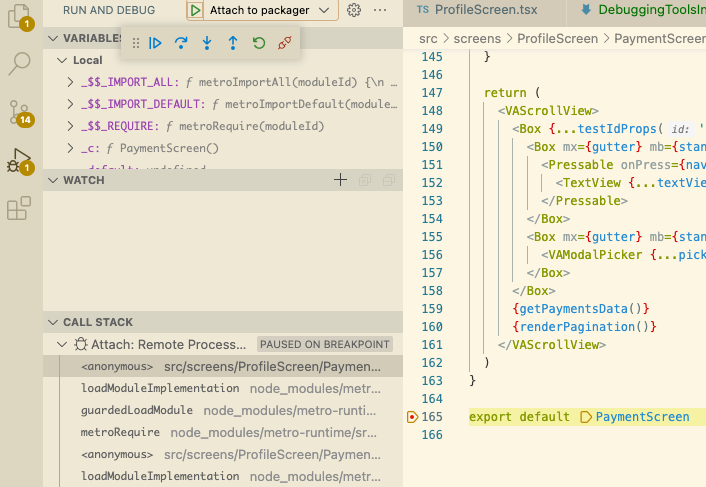
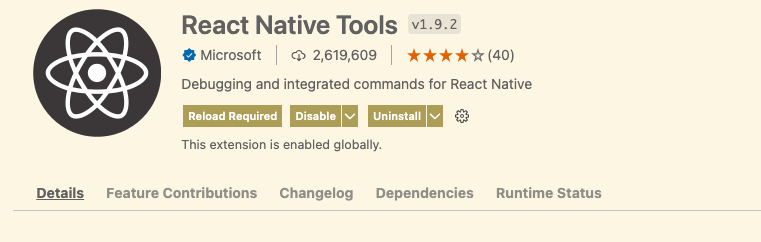
VSCode React Native Tools Extension
This extension will allow you to add breakpoints on the actual code in VSCode.
-
If not installed, install the React Native Tools extension in VSCode and follow the setup instructions in the extensions document.
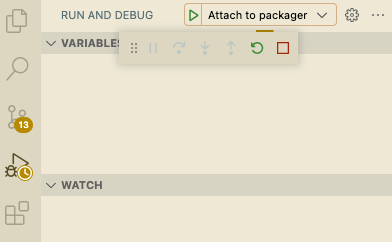
-
After the extension is installed launch the debugger. Select the Run and Debug Icon on the left explorer and click the play button on the Attach tp packager dropdown.
-
Launch the debugger from your device.
The debugger should attach to the VSCode debugger and stop on any breakpoints