Debugging Instructions
This page shows the different debug tools that we use to debug the VAMobile app. You can use your prefer method.
For all the debugging tools you need to yarn start the metro server so that the debugger can connect to it or it will not work.
Launching The Debugger
This section will apply to all the tools. More information on the react native debugging page
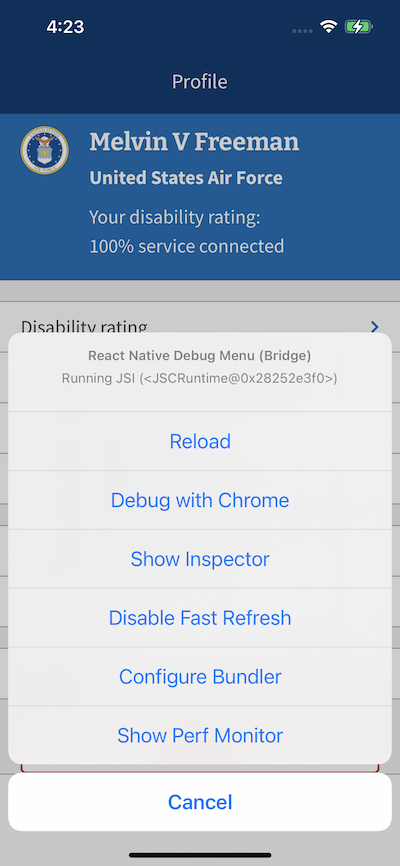
IOS
- If on
physical device Shake your device. If using asimulatorpress the shortcut⌘Dor by selecting theShake Gestureinside the hardware menu in the simulator. - On the Action Sheet select
Debug with Chrome
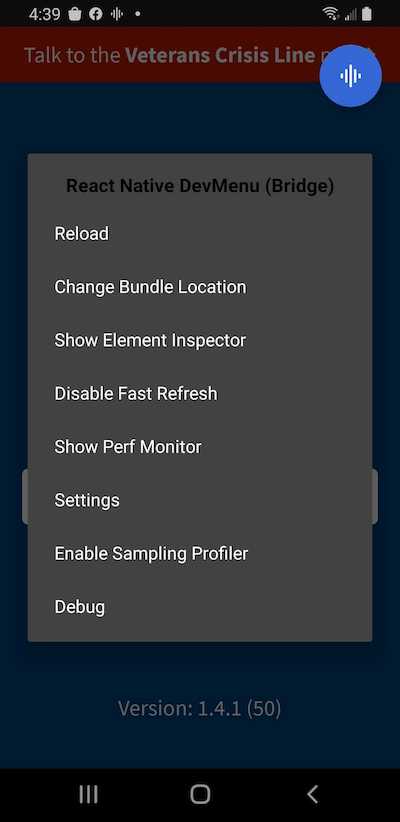
Android
- Ff on
physical device Shake your device. If using aemulatorpress the shortcut⌘M. - On the dialog select
Debug
Debugging Tools
This sections shows the different debugging tools you can use. By default the chrome developers tools will open if no other tool is already open.
You must have only the tool you want to use open so that the debugger connects to it.
Chrome Developers Tools
-
Launch the debugger from the device debug menu.
-
The
React Native Debuggerpage will open in Chrome on urlhttp://localhost:8081/debugger-ui/. You will know if the device is connected in theStatussection.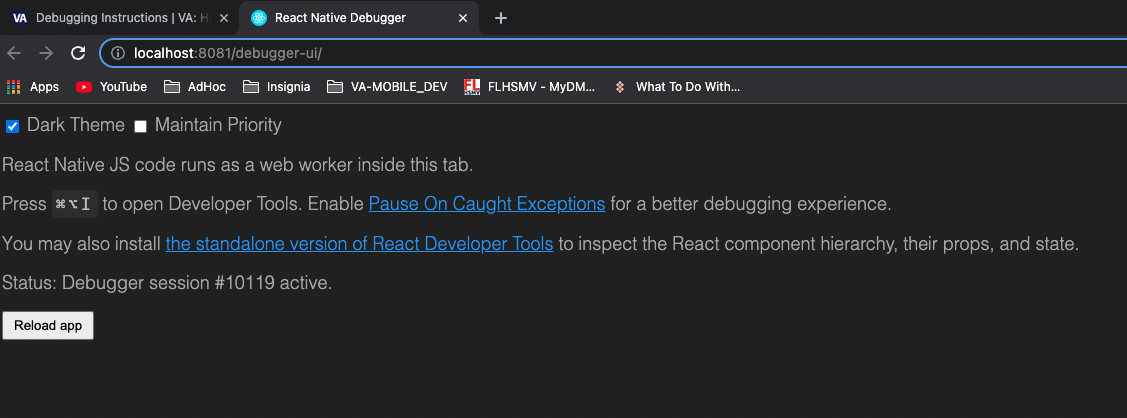
-
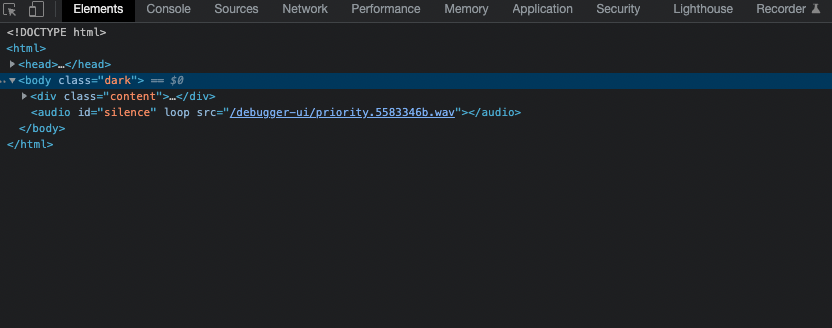
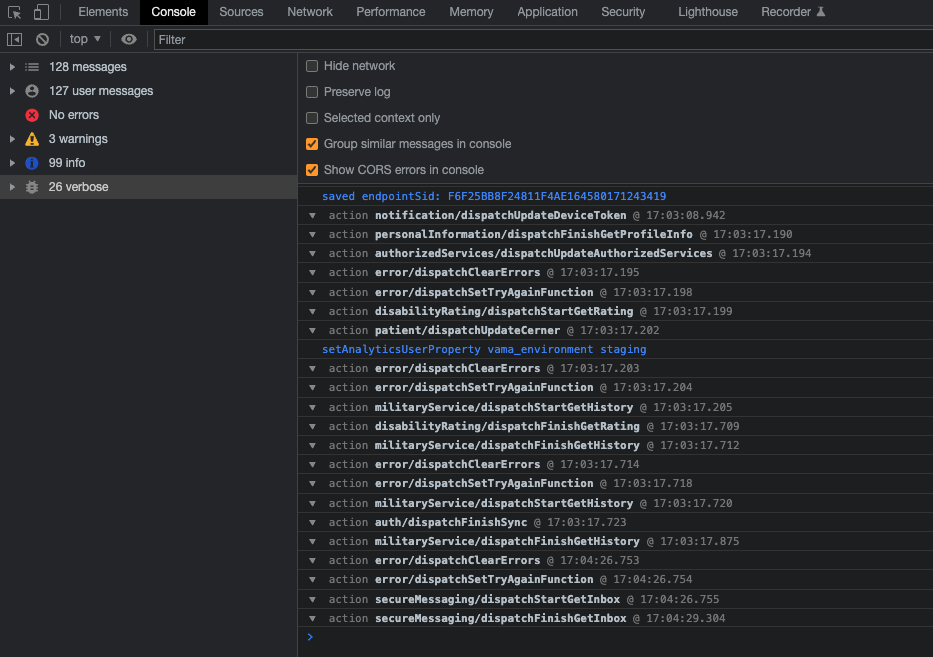
Open the developers tools. From the developers tools you can see the elements, console outputs and source files.
In the element you can see the html tree.
In the console you can see the redux logout messages and other console outputs.
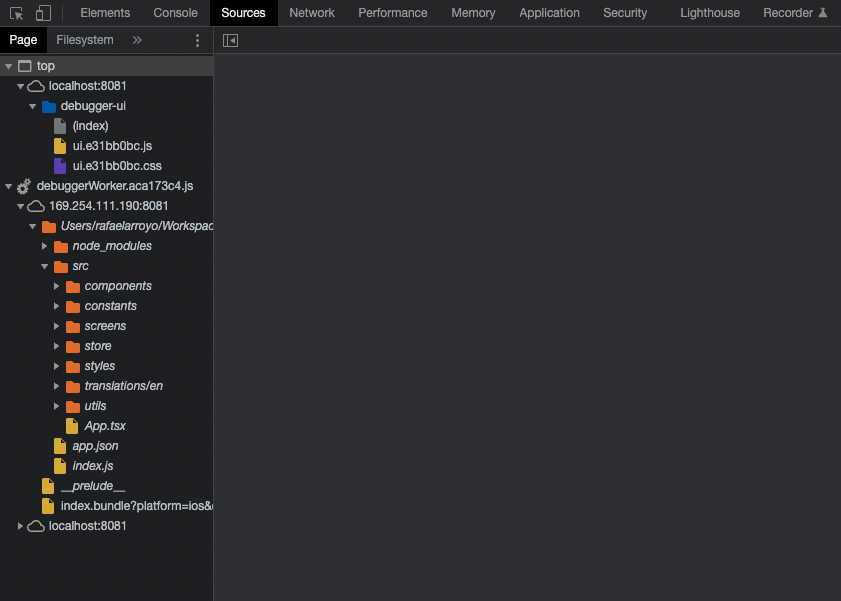
In the source under debuggerWorker you can find the javascript files that you can put breakpoints.
React Native Developer Tools (standalone application)
-
If not installed yet follow the installation instructions in the react-devtools to install the react dev tools globally on your machine not in the project. And than install standalone react native debugger app
-
If installed or after the installation launch the react native debugger standalone app.
-
Launch the debugger from your device.
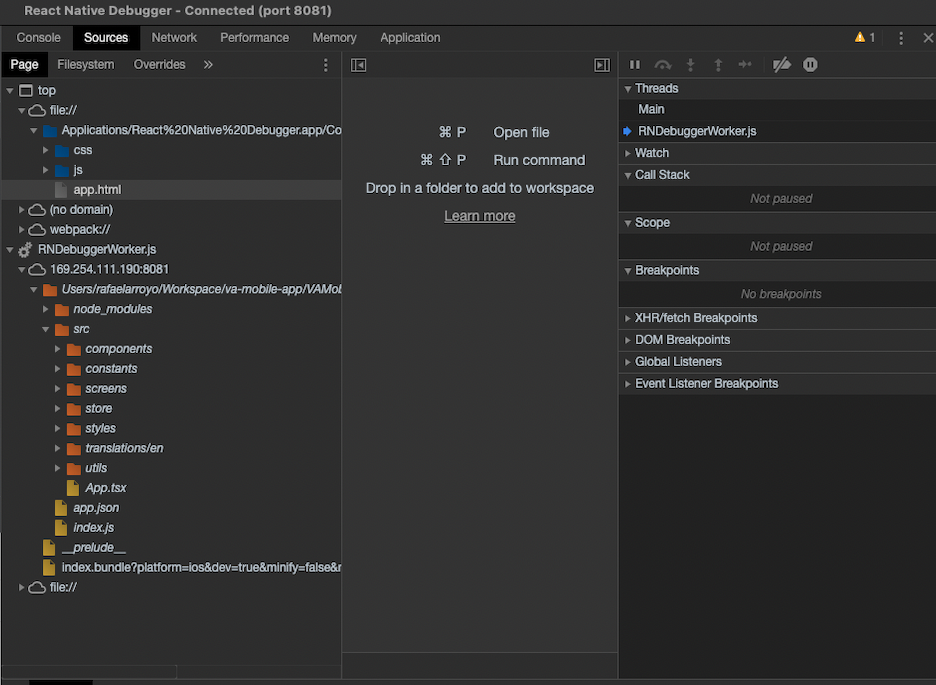
With the standalone you can see the redux messages with the redux devtools, see the element tree and console logs in the console tab.
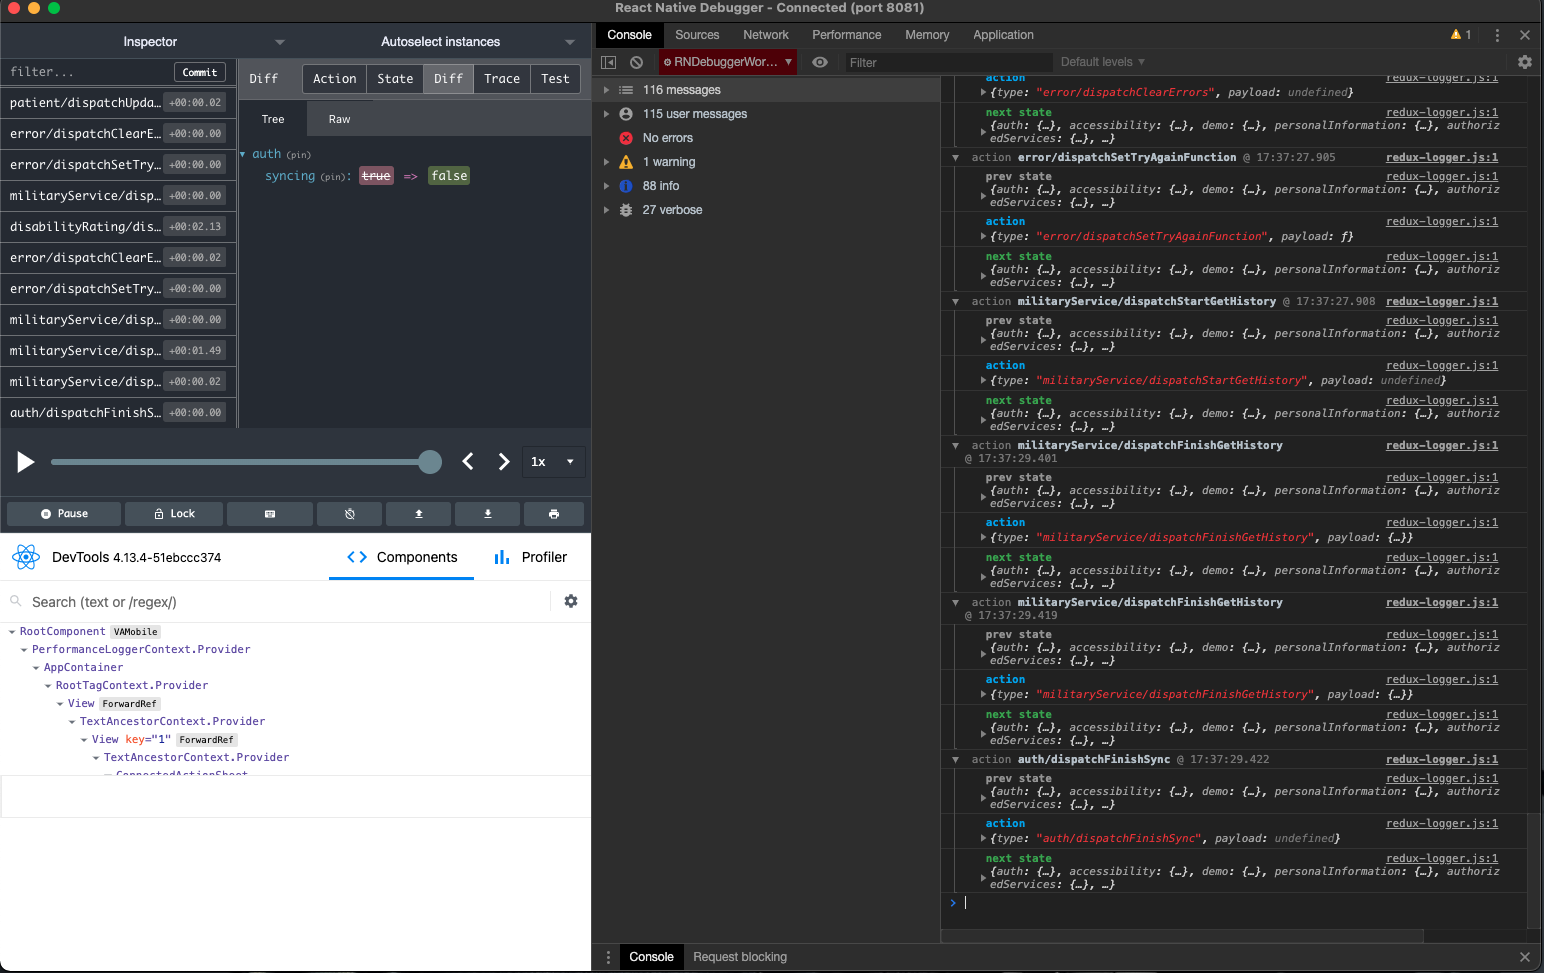
In the source tab under RNDebuggerWorker you can find the javascripts to add breakpoints to.
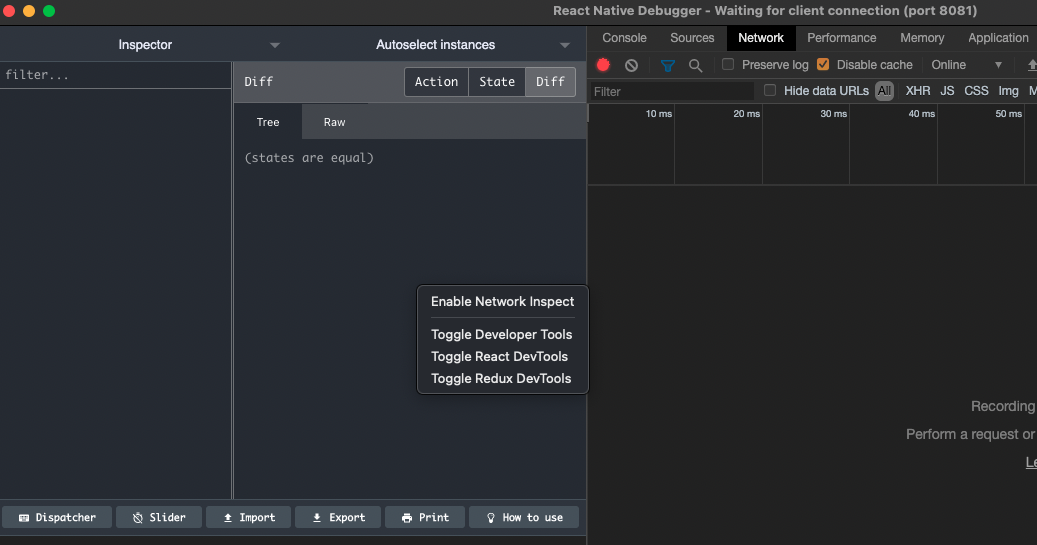
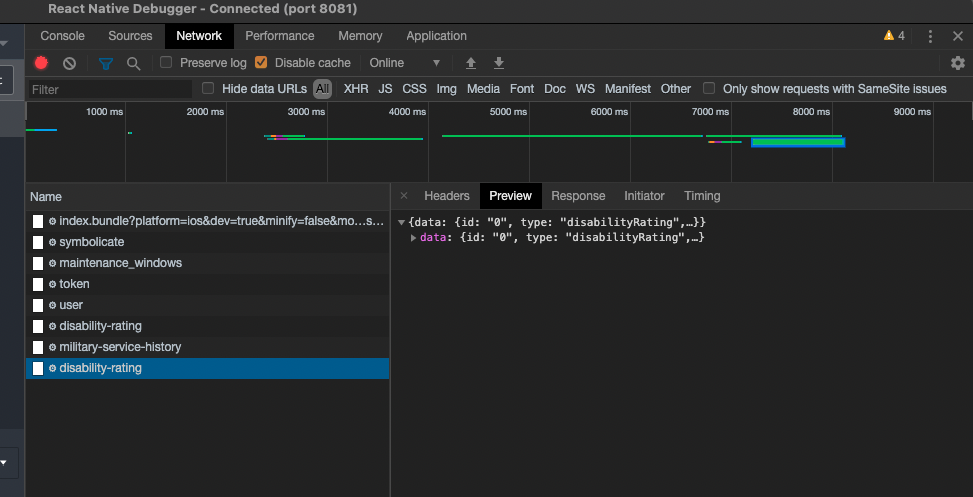
If you right click on the redux devtools section you will get a popup to enable network calls. This will allow you to see the calls and response done to the api.
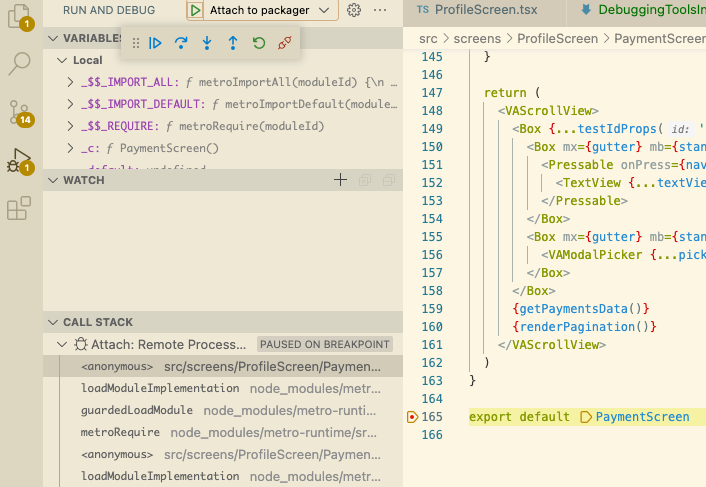
VSCode React Native Tools Extension
This extension will allow you to add breakpoints on the actual code in VSCode.
-
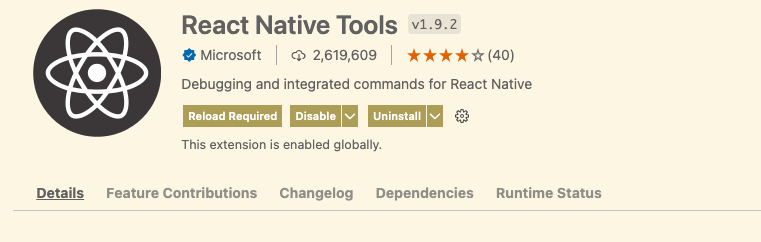
If not installed install the React Native Tools extension in VSCode and follow the setup instructions in the extensions document.
-
After the extension is installed launch the debugger. Select the Run and Debug Icon on the left explorer and click the play button on the Attach tp packager dropdown.
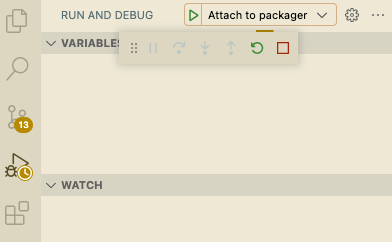
-
Launch the debugger from your device.
The debugger should attach to the VSCode debugger and stop on any breakpoints