How to view errors reported by CodeQL
Question
How can I view errors and warnings reported during a CodeQL scan?
Answer
There are two places to view errors reported by CodeQL, the tool health status and the result of running the CodeQL workflow. These do not necessarily show the same results. The health check may show warnings from running CodeQL that are not propagated to the top-level status of the action, however it only shows the most recent scan so may not show the results for a particular branch.
Both of these places should be checked for errors.
Tool Health Status
The Tool Health Status is found on the code scanning alerts page:
-
Navigate to your application’s GitHub repository and select the “Security” tab:
-
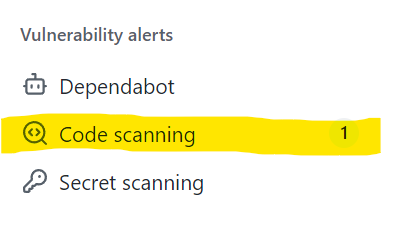
On the left-hand side of the “Security overview” page will be a section showing the number of open vulnerability alerts. Select the “Code scanning” menu item to view the alerts:
-
Near the top of the page is the Tool Status bar. If there’s a green “All tools are working as expected”, then there are no issues with CodeQL. However if the status is not green, (e.g., a yellow “CodeQL is reporting warnings” or a red “CodeQL is reporting errors”) more investigation is needed:

-
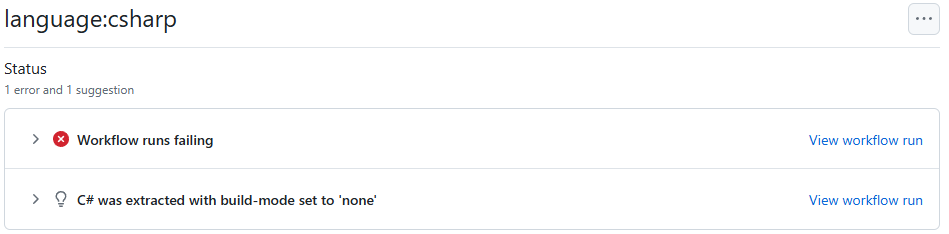
Click on the “CodeQL status page” link and it will show any errors or warnings for the most recent scan.
Workflow run
If you are coming from the tool health status page and the scan you are looking at is the most recent, you can view the workflow run just by clicking the “View workflow run” link by any scan errors or warnings.
Otherwise follow these steps to view the errors and warning in the workflow run:
-
Navigate to your application’s GitHub repository and select the “Actions” tab:

-
Select the CodeQL workflow run that corresponds to the CodeQL scan of interest:

-
Scroll to the bottom of the page of the workflow run. There is an “Annotations” section that will contain any errors or warnings:
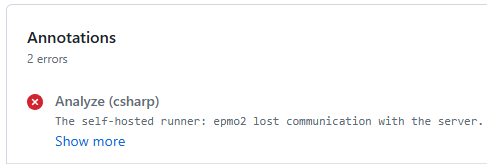
More details about the errors may be available in the workflow logs that can be viewed by clicking through the completed jobs.